
Bravo Reports Results of Pre-Feasibility Study for its Luanga Project
Base Case (Vertically Integrated Operation) Delivers US$1.45 Billion After-Tax NPV8% and 35.1% IRR
TORONTO, Sept. 22, 2026 /CNW/ — Bravo Mining Corp. (TSXV: BRVO) (OTCQX: BRVMF) (“Bravo” or the “Company”) is pleased to announce the results of an independent Pre-Feasibility Study (“PFS”, “PFS Technical Report” or the “Study”) relating to its 100% owned Luanga palladium + platinum + rhodium + gold + nickel deposit (“Luanga Project”, “Luanga” or the “Project”), located in the Carajás Mineral Province, Pará State, Brazil.
PFS Highlights:
- Base Case Economics Affirm Luanga’s Potential for a Large, Integrated, High Margin Mining Business
- After-tax Net Present Value (“NPV”) of US$1.45 billion, using an 8% discount rate.
- After-tax Internal Rate of Return (“IRR”) of 35.1%.
- Payback period, post-tax, of 2.0 years.
- Pre-production capital expenditures (“CAPEX”) of US$784.9 million and life-of-mine (“LOM”) sustaining CAPEX of US$98.2 million.
- NPV to CAPEX ratio: 1.65x.
- Average LOM C1 Cash Cost of US$478/oz 4E PGM and All-in Sustaining Cost (“AISC”) of US$706/oz 4E PGM.
- Commodity price assumptions: Pd US$1,245/oz, Pt US$1,700/oz, Rh US$8,000/oz, Au US$3,500/oz, Ni US$7.71/lb.
- Benefits associated with early start-up of vertical integration include US$90.2 million savings in smelter capex and US$41.20/t savings in operating costs directly related to fiscal benefits associated with the ZPE.
- Maiden Mineral Reserve Declared
- Proven & Probable (“2P”) Mineral Reserve of 86.7 Mt grading 2.77 g/t PdEq1 for 7,731 kOz of contained PdEq1.
- The Mineral Reserve is derived from the previously reported Measured and Indicated (“M&I”) Mineral Resources2 and does not take into account 22,100m of 2026 infill and expansion drilling.
- Reserve conversion ratio of 55% relative to the Measured and Indicated Mineral Resource tonnes and 74% on a PdEq1 metal contained basis.
- 10 Year LOM Production Based on Mineral Reserve
- Average annual production of payable metals/alloy: 208.9 kOz Pd, 150.7 kOz Pt, 16.1 kOz Rh, 18.1 kOz Au and 9.8k tonnes Ni per annum.
- Improved metallurgical recoveries associated with the application of Jameson Cell flotation technology, with forecast recoveries of 82% Pd, 80% Pt, 55% Rh, 88% Au and 71% Ni into a bulk PGM-nickel sulphide concentrate grading approximately 100 g/t PGM+Au and 7% Ni.
- Average LOM Strip Ratio of 6.6:1 waste:ore.
- Ongoing infill drilling program targeting the potential conversion of additional Inferred Mineral Resources to the M&I categories which, if successful, may support future mine-life extension and improved project economics.
- Vertically Integrated for In-Country Value Add – The ZPE Factor
- The Base Case envisages a new Bravo owned and operated smelter facility within the Barcarena Export Processing Zones (Zonas de Processamento de Exportação – “ZPE” or “Barcarena ZPE”), producing a saleable metal alloy while benefiting from the fiscal, customs and administrative incentives available under the ZPE regime.
- Bravo Metals has received authorization from Brazil’s National Council for Export Processing Zones to establish its industrial project within the Barcarena ZPE, representing an important step in advancing Bravo’s vertically integrated development strategy. See Bravo’s press release dated September 3, 2026.
- Strategic Geographical Advantage, Abundant Infrastructure and Advancing Permits
- Access to low-cost hydropower, power lines, highways, sealed roads, rail, water, skilled labour and industry service providers.
- 100% of the electricity consumed by the Luanga concentrate plant and the Barcarena ZPE smelter to be sourced from renewable energy sources.
- Key Licensing Milestone Achieved
- The Preliminary Licence (“LP”) was granted by SEMAS on March 3, 2025, following approval of the Project’s EIA/RIMA and public consultation process, confirming the environmental viability of Luanga’s location and development concept.
- The Company remains in full compliance with the conditions attached to the LP, with monitoring programs and required plans being executed within the deadlines set by SEMAS, demonstrating the strength of the Project’s regulatory standing.
- The PFS addresses the technical requirements underpinning the Installation Licence (“LI”) application, which is targeted for submission in Q4 2026.
- Financial Strength and Next Steps
- As of June 30, 2026, Bravo had cash and cash equivalents of approximately US$94.1 million, well in excess of the funding currently anticipated to be required to update its mineral resource update (“MRE”), complete a Definitive Feasibility Study (“DFS”) and reach Final Investment Decision (“FID“), while continuing to advance permitting and other Project and corporate development activities, as well as exploration for additional PGM, IOCG and magmatic sulphide deposits.
- Development Cases Evaluated
- Four development cases were evaluated: two at the Pre-Feasibility Study level (AACE Class 4) and two at the Preliminary Economic Assessment (“PEA”) level (AACE Class 5):
- The Base Case contemplates an open pit mine and concentrator located at the mine site, together with a smelter located within the Barcarena ZPE, approximately 600 km from the mine. The smelter will process the concentrate to produce a saleable metal alloy. Under the Base Case development schedule, the mine site infrastructure, concentrator and smelter are constructed concurrently.
- Alternate Case A maintains the same mine and concentrator development schedule as the Base Case but provides for staged smelter development, with initial production sold as flotation concentrate followed by the integration of the smelter in Year 3. Alternate Case A was also evaluated at a Pre-Feasibility Study level and classified as AACE Class 4.
- Alternate Case B applies the Base Case configuration but at a reduced throughput of 5 Mtpa, compared with 10 Mtpa under the Base Case, with corresponding adjustments to the modifying factors. This case was evaluated at a Preliminary Economic Assessment level and classified as AACE Class 5.
- The Opportunity Case developed a mine plan and economic model applying the Base Case modifying factors, inputs, assumptions, capital cost, and operating cost bases to the current Mineral Resource Estimate block model, including the Measured, Indicated and Inferred categories. The mine schedule contemplates mineralised material mined of 123.3 million tonnes of which 33.1 million tonnes (27%) were attributable to the Inferred category. The Inferred tonnes included in this schedule are equal to 44% of the total (non-oxide) current Inferred Resources. This case was evaluated at a Preliminary Economic Assessment level and classified as AACE Class 5.
- Four development cases were evaluated: two at the Pre-Feasibility Study level (AACE Class 4) and two at the Preliminary Economic Assessment (“PEA”) level (AACE Class 5):
|
Indicator |
Base Case |
Alternate Case A |
Alternate Case B |
Opportunity Case |
|
Study Class (AACE) |
Class 4 |
Class 4 |
Class 5 |
Class 5 |
|
Study Status |
PFS |
PFS |
PEA |
PEA |
|
After-tax NPV (US$M) |
1,449 |
1,214 |
1,151 |
1,777 |
|
After-tax IRR (%) |
35.1 % |
31.5 % |
30.6 % |
32.0 % |
|
Payback, post-tax (years)* |
2.0 |
2.5 |
2.5 |
2.5 |
|
4E PGM Average Annual Production (Oz) |
393,847 |
382,656 |
195,281 |
410,311 |
|
*Post-construction payback. |
||||
Table 1: Summary Development Cases Economics
“The completion of the Luanga PFS represents a major milestone for Bravo and, importantly, establishes a maiden Mineral Reserve based entirely on Measured and Indicated Resources. The Base Case demonstrates robust economics, with an after-tax NPV8% of ~US$1.45 billion, a 35.1% IRR and a two-year post-tax payback, while supporting a 10-year mine life,” said Luis Azevedo, Chairman & CEO.
“Just as important, the PFS validates the strategy we have been advancing for more than two years: to vertically integrate Luanga in Brazil. The Project’s strong economics, together with the benefits available within the Barcarena ZPE, more than offset the additional capital required for the smelter. In the global PGM industry, vertical integration through smelting and downstream processing is largely the norm, reflecting the strategic and economic benefits of capturing more of the value chain. Incorporating a smelter within the Barcarena ZPE brings Luanga closer to that model, allowing us to move from selling concentrate to producing a saleable metal alloy in Brazil, while reducing our exposure to third-party treatment and offshore logistics costs. This strategy is also closely aligned with Brazil’s critical minerals agenda, which increasingly emphasizes domestic processing and greater value addition within the country rather than simply exporting mineral products. The formal authorization of Bravo Metals within the Barcarena ZPE is an important step in making that strategy possible.”
“We also see meaningful opportunity beyond the PFS Base Case, as demonstrated by the alternate development cases, which continue to deliver strong economic results. Our 2026 drilling continues to target conversion and expansion of the existing Mineral Resource, with drilling completed after the current MRE not reflected in the Mineral Reserve or economics announced today. We are targeting an updated Mineral Resource in Q1 2027 while advancing permitting, the next phase of engineering and the Project toward a Definitive Feasibility Study. With approximately US$94 million in cash as of June 30, 2026, Bravo is well funded to continue this work and advance Luanga through its next stage of development.”
|
1Note on Palladium Equivalent – For grades by individual metals, see Tables 10 and 11 below, where the footnotes detail the basis of the Palladium Equivalent calculation. |
PFS Overview
The PFS is presented with a Base Case considering a vertically integrated operation comprising conventional open pit mining, a flotation concentrator incorporating an updated comminution and Jameson cell flotation circuit, and an in-country pyrometallurgical smelter located within the Barcarena Processing and Export Free Trade Zone (“ZPE”), producing a saleable metal alloy for direct sale (the “Base Case”), as well as a sulphuric acid plant producing product for consumption by local fertilizer plants.
An alternative case (the “Alternate Case A”) contemplating staged smelter development was also evaluated as part of the PFS financial model. Both Base Case and Alternate Case A were prepared at prefeasibility level (AACE Cass 4*) in accordance with National Instrument 43-101 – Standards of Disclosure for Mineral Projects (“NI 43-101”).
|
*AACE Class 4 refers to the cost-estimate classification established by AACE International based on the level of project definition and the intended use of the estimate. The PFS cost estimates have an expected accuracy range of −20%/+30, including contingency. |
Two additional preliminary economic scenarios were evaluated using AACE Class 5** cost estimates. Alternate Case B applies the Base Case configuration and corresponding modifying factors at a reduced throughput of 5 million tonnes per annum (“Mtpa“), compared with 10 Mtpa under the Base Case. This case provides a potential lower upfront capital alternative. The Opportunity Case applies the Base Case modifying factors, inputs, assumptions and cost bases to the current Mineral Resource Estimate block model, including Measured, Indicated and Inferred Mineral Resources. This case justifies the ongoing infill and mineral resource conversion drilling program that is currently well advanced. These scenarios are summarised under “Project Opportunities” section of this press release. Neither of these scenarios are part of the PFS.
|
**AACE Class 5 refers to a conceptual-level cost-estimate classification established by AACE International based on the level of project definition and intended use of the estimate. The Class 5 cost estimates have an expected accuracy range of −30%/+50%. |
Importantly, this PFS represents an advance on the Company’s 2025 Preliminary Economic Assessment (“2025 PEA”) in that it incorporates, for the first time, a Mineral Reserve estimate for the Project, prepared in accordance with NI 43-101.
Technical Report
A technical report (the “PFS Technical Report“) will be filed on SEDAR+ within 45 days of this news release and that report supersedes and replaces the 2025 PEA, which should no longer be relied upon.
Once filed on SEDAR+, readers are encouraged to read the Company’s PFS Technical Report, prepared in accordance with NI 43-101, in its entirety. The PFS Technical Report contains all qualifications, assumptions and exclusions that relate to the PFS, the Mineral Reserve estimate and the Mineral Resource estimate upon which the PFS is based. The PFS Technical Report is intended to be read as a whole, and sections should not be read or relied upon out of context.
The Company retained GE21 Consultoria Mineral Ltda. (“GE21”) as Bravo’s independent mining engineering consultants (with offices located in Belo Horizonte, Minas Gerais, Brazil), together with Onix Engenharia e Consultoria (Infrastructure, mechanical and electrical engineering), Dr. Rodney Jones (Pyrometallurgy), Luis Navarro (Geotechnical) and Landi Borges (Tailings Storage Facilities), to prepare the PFS in accordance with NI 43-101. See “Technical Disclosure and Qualified Persons” below for the complete list of independent Qualified Persons (“QPs”) responsible for each discipline.
The Mineral Reserve estimate and the PFS have an effective date of September 16, 2026. The Mineral Resource estimate underpinning the Mineral Reserve has an effective date of February 18, 2025 and excludes 22,100m of mineral resource infill and expansion drilling to be completed in 2026, a program which is currently ongoing.
Consistent with NI 43-101, the PFS-level Base Case production schedule is derived solely from Proven and Probable Mineral Reserves. Inferred Mineral Resources are not included in the Base Case mine plan or financial model; this differs from the 2025 PEA, which included Inferred Mineral Resources in its production schedule, as is permitted for a PEA level study.
The PFS financial model was used to evaluate several alternative project configurations in addition to the Base Case, varying processing route, smelter construction phasing, and production scale.
Only the Base Case is presented in the highlights and summary tables in the section below; the alternative cases are described under “Project Opportunities”.
PFS Summary
Mining
Luanga is characterised by consistent geological continuity, near-surface mineralisation and steeply dipping mineralised zones that are amenable to open-pit extraction.
The PFS contemplates conventional open pit (“OP”) mining using a truck-and-shovel operation, over a mine life of 9.6 years based on the declared Mineral Reserve. During the period under study, ore would be sourced from three open pits, while material between the mineral reserve and marginal processing cut-off grades would be stockpiled for treatment later in the operational life. Drilling, blasting, loading and hauling are assumed to be performed by contractors.
The mining fleet is assumed to be composed of a dedicated ore and waste fleet, respectively. The ore mining fleet pairs 4.6m3 excavators with 55t load capacity trucks while the waste fleet pairs 8m3 excavators with 120t load capacity trucks. All aspects of the fleet model assume 85% availability, 80% utilisation and 95% efficiency.
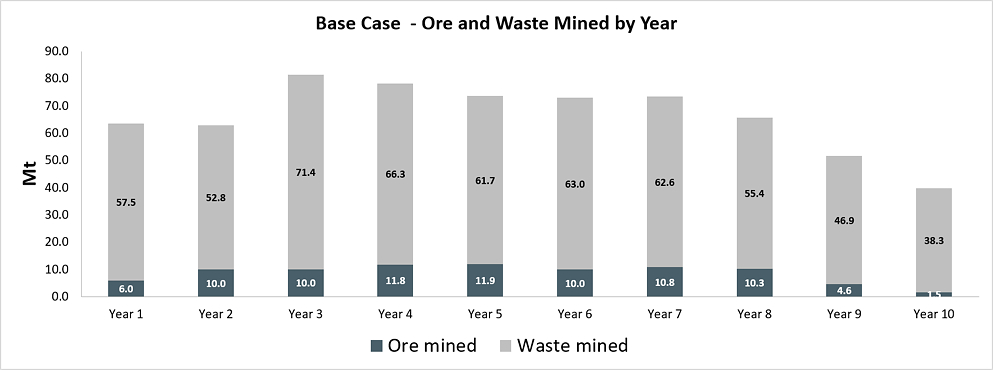
Maximum material movement is projected to peak at 81.4 Mtpa. Over the LOM, a total of 662.8 million tonnes is planned to be mined, including 86.7 million tonnes of ore at an average strip ratio of 6.6:1 waste:ore.
Waste rock would be placed in a designated storage facility. Tailings would be directed to a conventional tailings storage facility, sized for the LOM tailings expected to be generated following ore processing.
Ore Processing
The Base Case process plant is designed around an updated comminution and concentration flowsheet incorporating Jameson flotation cells, ramping up to a nameplate throughput of 10 Mtpa (27,400 tpd) by the end of Year 1, and producing a nickel–gold–platinum group metals bulk (Ni-Au-PGM) flotation concentrate.
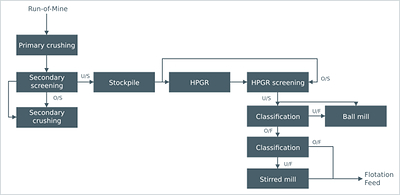
The comminution circuit now incorporates two-stage crushing, high pressure grinding rollers, conventional ball mill and stirred mill.
This configuration replaces the PEA configuration which included MMD sizers as primary crushing function, a SAG mill, a coarse- and two fine-duty ball mills. The process circuit was reviewed post-PEA, based on recent extensive metallurgical variability and locked-cycle flotation test work, and improved to accommodate for hardness variability and fine grind requirements to support optimal flotation performance.
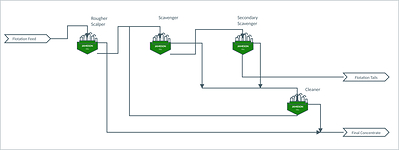
In contrast, beneficiation of the mineral products in the 2025 PEA envisaged the use of conventional mechanical froth flotation cells. The 2026 PFS incorporates Jameson Cell flotation technology, supported by expanded metallurgical test work demonstrating generally improved metal recoveries and improved selectivity to concentrate. Based on extensive post-PEA metallurgical testing, the PFS assumes recoveries of 82% Pd, 80% Pt, 55% Rh, 88% Au and 70% Ni, into a concentrate grading approximately ~100 g/t PGM+Au, compared with the ~80 g/t PGM+Au concentrate grade contemplated in the 2025 PEA.
Concentrate Processing
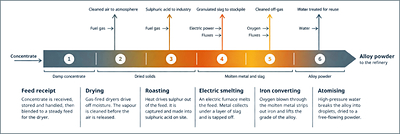
Under the Base Case, flotation concentrate is to be processed at a pyrometallurgical smelter located within the Barcarena ZPE at the Port of Vila do Conde, ~600km from the mine site. The smelter unit operations include calcination/roasting for sulphur extraction (generating sulphuric acid as by-product), followed by electric arc furnace smelting, converting, and atomising to produce a final saleable metal alloy.
The alloy yield is estimated at 10%, consisting of PGM, Au, Ni, and other minor base metals. Sulphuric acid generated from the roasting stage is sold to fertiliser producers. Credits for sulphuric acid sales are incorporated into the PFS financial model.
All smelter parameters and the flowsheet development have been developed by independent consultant, Dr. Rodney Jones, who brings over 40 years of experience in the design and implementation of pyrometallurgical smelter plants in South Africa and internationally.
Mine Production Plan
The key LOM production metrics and outcomes for the Base Case are summarised below:
|
Item |
Units |
Value |
|
LOM Throughput |
tpd |
~23,745 |
|
Peak Process Plant Throughput |
Mta |
10.0 |
|
Peak Mining Rate (ore + waste) |
Mta |
81.4 |
|
Mine Production (LOM) |
||
|
Total Mined (ore + waste) |
Mt |
662.8 |
|
Total Waste Mined |
Mt |
576.1 |
|
Total Mineral Reserve Mined (Ore) |
Mt |
86.7 |
|
Strip Ratio |
t/t (Waste/Reserve) |
6.6:1 |
|
Payable Metal / Alloy Content (LOM) |
||
|
Palladium |
kOz |
2,089 |
|
Platinum |
kOz |
1,507 |
|
Rhodium |
kOz |
161 |
|
Gold |
kOz |
181 |
|
Nickel |
Tonnes |
98,247 |
|
Sulphuric Acid Production (LOM) |
||
|
Sulfuric Acid (H₂SO₄) |
kt |
878 |
Table 2: Base Case Production Summary
Mine Production Schedule
The Base Case production schedule is based on the Mineral Reserve estimate with an effective date of September 16, 2026.
The Base Case production schedule assumes a 9.6-year LOM. Table 3 below sets out the projected LOM annual production schedule for the Base Case, derived from the declared Mineral Reserve.
|
Year |
Ore |
PdEq1 |
Pd |
Pt |
Rh |
Au |
Ni |
Waste |
Strip |
Total |
|
Mt |
g/t |
g/t |
g/t |
g/t |
g/t |
% |
Mt |
x |
Mt |
|
|
Year 1 |
6.0 |
3.24 |
0.95 |
0.85 |
0.12 |
0.08 |
0.21 |
57.5 |
9.66 |
63.5 |
|
Year 2 |
10.0 |
3.52 |
1.10 |
0.80 |
0.13 |
0.11 |
0.23 |
52.8 |
5.28 |
62.8 |
|
Year 3 |
10.0 |
3.10 |
1.04 |
0.72 |
0.12 |
0.08 |
0.19 |
71.4 |
7.12 |
81.4 |
|
Year 4 |
11.8 |
2.56 |
0.86 |
0.68 |
0.10 |
0.06 |
0.14 |
66.3 |
5.62 |
78.1 |
|
Year 5 |
11.9 |
2.45 |
0.87 |
0.62 |
0.09 |
0.05 |
0.13 |
61.7 |
5.20 |
73.6 |
|
Year 6 |
10.0 |
2.87 |
0.93 |
0.67 |
0.11 |
0.07 |
0.18 |
63.0 |
6.34 |
73.0 |
|
Year 7 |
10.8 |
2.84 |
0.82 |
0.69 |
0.11 |
0.08 |
0.19 |
62.6 |
5.82 |
73.4 |
|
Year 8 |
10.3 |
3.03 |
1.07 |
0.66 |
0.10 |
0.09 |
0.18 |
55.4 |
5.39 |
65.7 |
|
Year 9 |
4.6 |
2.39 |
0.70 |
0.54 |
0.08 |
0.06 |
0.18 |
46.9 |
10.27 |
51.5 |
|
Year 10 |
1.5 |
2.26 |
0.68 |
0.53 |
0.08 |
0.05 |
0.16 |
38.3 |
25.21 |
39.8 |
|
TOTAL / LOM |
86.7 |
2.88 |
0.93 |
0.69 |
0.11 |
0.08 |
0.18 |
576.1 |
6.64 |
662.8 |
Table 3: Base Case Mine Production Schedule
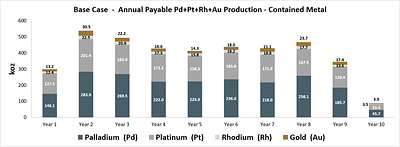
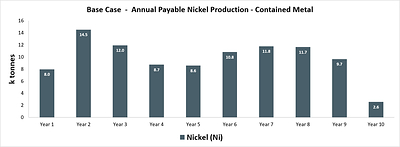
Figures 5 and 6 illustrate the annual metal production by contained metal.
Metallurgy Recoveries
Since completion of the 2025 PEA, Bravo has undertaken an extensive metallurgical test work program focused on variability, as well as improving metal recoveries, concentrate grades and overall flotation performance through the application of Jameson Cell technology. Testing on representative Luanga sulphide material demonstrated improved recoveries relative to conventional flotation cells, particularly for palladium, gold and nickel, together with improved selectivity and reduced mass pull as compared to the 2025 PEA.
The program was conducted independently at Base Metallurgical Laboratories (Intertek) and incorporated Glencore Technology’s standardized Jameson Cell test protocols, with Glencore Technology also providing technical review, flowsheet design support and independent verification of the metallurgical performance assumptions adopted for the 2026 PFS.
The resulting PFS assumptions reflect an increased target concentrate grade of approximately 100 g/t PGM+Au, compared with 80 g/t in the 2025 PEA, while achieving improved recoveries across most of the payable metal suite.
Metallurgical recoveries used in the Mineral Reserve estimate and PFS are as follows:
|
Element |
Recovery PEA 2025 |
Recovery PFS 2026 |
Difference |
|
Pd |
77.0 % |
81.5 % |
+4.5 % |
|
Pt |
81.0 % |
80.0 % |
-1.0 % |
|
Rh |
51.0 % |
55.0 % |
+4.0 % |
|
Au |
48.0 % |
88.0 % |
+40.0 % |
|
Ni |
50.0 % |
70.6 % |
+20.6 % |
|
Global 4E |
78.0 % |
80.1 % |
+2.1 % |
Table 4: Metallurgy Recovery Assumptions
For the Base Case, process recoveries in the smelter were assumed at 98% for PGMs+Au (“4E PGM“) and 90% for Ni, derived from Bravo`s preliminary furnace tests, thermochemical modelling and chemically matched furnace test data sets.
Site Layout for the Luanga PFS
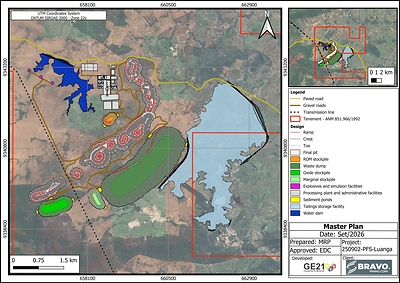
The PFS Project site layout, as shown in Figure 7, sets out the proposed locations of the open pits, concentrator plant and related Project infrastructure, ore stockpiles, waste rock storage facilities, tailings storage facility (“TSF”) and water supply dam.
The plan shows the updated location of the proposed tailings storage facility, with the Project now adopting a conventional TSF, compared with the dry-stacked TSF contemplated in the previous PEA. The change to a conventional TSF was driven mainly by technical, safety and economic considerations, including site topography, distance from settlements, tailings volumes and characteristics.
The proposed TSF will use downstream construction methods and will comply with Brazil’s strict regulations for TSFs as well as aligning with the Global Industry Standard on Tailings Management (“GISTM“) framework, which is aimed at achieving zero harm in the management of mine tailings facilities.
Capital Costs
The estimated initial CAPEX for construction and ramp-up, together with expected sustaining capital and closure costs, are presented in Table 5 below. These estimates are to an AACE Class 4 estimate (-20%/+30%), an improvement in confidence relative to the AACE Class 5 estimate used in the 2025 PEA (-30%/+50%).
The capital cost estimate contains an embedded 15% contingency allowance for all items.
|
CAPEX Item |
US$M |
|
Pre-Production Mine Site & Plant |
|
|
Mining & pre-production |
19.7 |
|
Process plant, mechanical equipment |
280.6 |
|
Civil works, buildings & earthworks |
51.6 |
|
Electrical, substation & distribution |
65.3 |
|
Tailings storage facility |
14.5 |
|
Water storage dam |
15.2 |
|
Indirect costs (freight, imports, first fill) |
30.2 |
|
Owner’s costs |
47.7 |
|
EPCM |
71.6 |
|
Financial costs (insurance & taxes) |
7.2 |
|
Contingency (15% embedded) |
– |
|
Subtotal – mine site & plant growth capital |
603.6 |
|
Pre-Production Smelter |
|
|
ZPE smelter (Barcarena) – growth capital |
181.3 |
|
TOTAL Pre-Production CAPEX |
784.9 |
|
SUSTAINING CAPITAL (LOM) |
|
|
Mine site & plant sustaining capital |
83.9 |
|
Smelter sustaining capital |
14.3 |
|
TOTAL SUSTAINING CAPITAL |
98.2 |
|
CLOSURE |
|
|
Mine closure & rehabilitation (LOM) |
25.6 |
|
TOTAL CAPEX (LOM) |
908.7 |
Table 5: Initial and Sustaining CAPEX Estimates – Base Case
Operating Costs
The Luanga Project operating costs (“OPEX”) for the Base Case are presented in Table 6.
|
Description |
US$M (LOM) |
Unit cost |
|
MINING |
||
|
Ore mining |
362.8 |
|
|
Waste rock mining |
2,039.3 |
|
|
Marginal material mining |
46.8 |
|
|
Oxide / weathered material mining |
67.3 |
|
|
Grade control, geology & mine management |
24.5 |
|
|
Total mining cost |
2,540.7 |
US$3.83 /t moved |
|
PROCESSING |
||
|
Labour |
55.1 |
|
|
Power |
124.0 |
|
|
Reagents (flotation & others) |
159.3 |
|
|
Laboratory |
20.8 |
|
|
Media & liners |
197.9 |
|
|
Plant maintenance supplies |
59.3 |
|
|
Plant maintenance services |
65.2 |
|
|
Equipment rental |
15.6 |
|
|
Tailings & water dams |
37.9 |
|
|
Other costs (10% of total) |
68.2 |
|
|
Total processing cost |
803.3 |
US$9.26 /t milled |
|
SMELTING (ZPE – Barcarena) |
||
|
Energy – electricity & natural gas |
70.9 |
|
|
Consumables – electrodes, reductant, flux, oxygen, refractories |
34.7 |
|
|
Labour |
46.3 |
|
|
Maintenance – materials & contracted services |
27.3 |
|
|
Smelter G&A – insurance, environmental, legal, IT, travel |
11.4 |
|
|
Concentrate Logistics |
50.2 |
|
|
Total smelting cost |
240.8 |
US$164.20 /t concentrate |
|
GENERAL & ADMINISTRATION |
||
|
G&A – mine site |
316.8 |
|
|
G&A Bravo Mining – corporate / head office |
84.0 |
|
|
G&A Bravo Metals – ZPE corporate / head office |
35.0 |
|
|
Total G&A |
475.3 |
US$5.48 /t milled |
|
OTHER |
||
|
Irrecoverable taxes (PIS/COFINS & ICMS) on operating costs |
64.3 |
|
|
TOTAL OPERATING COST (LOM) |
4,124.3 |
US$47.56 /t milled |
Table 6: OPEX Estimates – Base Case
Mining costs assume a diesel price of US$1.13/litre delivered to site, reflecting current elevated pricing and approximately 20% higher than 12 months ago.
Economic Analysis – Base Case
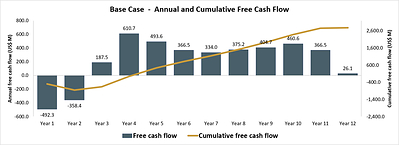
The cash flow model is based on the assumed production schedule, associated metal grades, metallurgical recoveries and capital and operating costs outlined in this news release. Table 7 shows the Luanga Project PFS highlights for the Base Case.
|
Item |
Unit |
Base Case Value |
|
RETURNS |
||
|
After-tax NPV @ 8% discount (real) |
US$M |
1,448.7 |
|
After-tax IRR (real) |
% |
35.1 % |
|
Payback period, post-tax** |
years |
2.0 |
|
Peak funding requirement |
US$M |
877 |
|
NPV / CAPEX (peak funding)* |
x |
1.65 |
|
Project free cash flow (LOM, undiscounted) |
US$M |
2,815 |
|
SCALE |
||
|
Life of mine |
years |
9.6 |
|
Total ore mined |
Mt |
86.7 |
|
Total waste mined |
Mt |
576.1 |
|
Total ore processed |
Mt |
86.7 |
|
Average plant feed rate |
Mtpa |
8.67 |
|
Peak plant feed rate |
Mtpa |
10.03 |
|
Strip ratio (LOM average) |
x |
6.64 |
|
Head grade – PdEq1 |
g/t |
2.9 |
|
Concentrator recovery – 4E (mix-weighted) |
% |
80 % |
|
PRODUCTION |
||
|
Concentrate produced (dry) |
kt |
1,466.7 |
|
Concentrate smelted |
kt |
1,466.7 |
|
PGM-Ni alloy produced |
kt |
146.7 |
|
Sulphuric acid produced |
kt |
878.1 |
|
Total payable 4E |
kOz |
3,937.9 |
|
Average annual payable 4E PGM production |
kOz/y |
393.8 |
|
Payable Ni |
kt |
98.2 |
|
REVENUE & COST |
||
|
Gross revenue – total |
US$M |
9,322.9 |
|
Net revenue |
US$M |
8,346.4 |
|
Net revenue per 4E ounce |
US$/oz |
2,119.5 |
|
EBITDA (LOM) |
US$M |
4,196.6 |
|
EBITDA margin (LOM) |
% |
50.3 % |
|
Total operating cost |
US$M |
4,124.2 |
|
Operating cost per tonne milled |
US$/t |
$47.56 |
|
C1 Cash Cost* |
US$/oz 4E |
$478.2 |
|
All-in Sustaining Cost (AISC)* |
US$/oz 4E |
$706.4 |
|
CAPITAL |
||
|
Total growth capital |
US$M |
784.9 |
|
Sustaining capital (LOM) |
US$M |
98.2 |
|
Total capital (LOM) |
US$M |
908.7 |
|
TAXATION & ROYALTIES |
||
|
Gov’t (CFEM), Private Royalties (Vale, BNDES and Landowner) |
US$M |
774.6 |
|
Income tax charge (IRPJ & CSLL) |
US$M |
511.0 |
|
SUDAM benefit realised |
US$M |
(628.3) |
|
Effective tax rate (LOM) |
% |
15.25 % |
|
*See Non-IFRS Measures below., **Post-construction payback. |
Table 7: PFS Highlights – Base Case
Payabilities and/or realised alloy pricing terms applicable to the Base Case assumed current market toll treatment rates with a European metals refiner and equates to $25/oz.
|
*See Non-IFRS Measures below |
Sensitivity Analysis
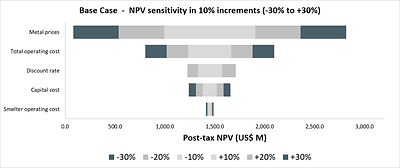
Sensitivity analysis considered variations to metal pricing, CAPEX, OPEX and NPV discount rate for the Base Case. Figure 9 and Table 8 present the sensitivity analyses for the Luanga Project PFS.
|
Driver |
-30 % |
-20 % |
-10 % |
Base |
+10 % |
+20 % |
+30 % |
|
Metal prices |
80.6 |
536.6 |
992.7 |
1,448.7 |
1,904.7 |
2,360.7 |
2,816.7 |
|
Total operating cost |
2,095.0 |
1,879.5 |
1,664.1 |
1,448.7 |
1,233.2 |
1,017.8 |
802.4 |
|
Smelter operating cost |
1,486.9 |
1,474.1 |
1,461.4 |
1,448.7 |
1,435.9 |
1,423.2 |
1,410.5 |
|
Capital cost |
1,657.7 |
1,588.0 |
1,518.4 |
1,448.7 |
1,379.0 |
1,309.3 |
1,239.6 |
Table 8: NPV Sensitivity Analysis
Metal Price Assumptions
Metal prices for the PFS were assumed on a long-term, real basis.
Assumed platinum, palladium, gold and nickel prices were developed with reference to the long-term, real price forecasts published by Consensus Economics Inc. in August 2026.
No long term, real forecasts are available for rhodium; a review was conducted of peer economic study forecasts, as well as recent market trends and pricing behaviour to determine the appropriate pricing for rhodium. The resulting LOM average Luanga PFS price deck is presented in Table 9.
|
Commodity |
Luanga PFS Price Deck (US$) |
|
Palladium (US$/Oz) |
1,245 |
|
Platinum (US$/Oz) |
1,700 |
|
Rhodium (US$/Oz) |
8,000 |
|
Gold (US$/Oz) |
3,500 |
|
Nickel (US$/tonne) |
17,000 |
Table 9: Metal Price Assumptions
Based on the LOM production weighting of each 4E PGM metal, the above pricing assumptions equate to a basket price of US$1,798/oz.
The sulphuric acid price assumption has been set at US$650 per tonne, reflecting the historical average CRU benchmark price for Rio Grande do Sul prior to the onset of the Iran conflict, plus estimated freight and delivery costs to northern Pará State.
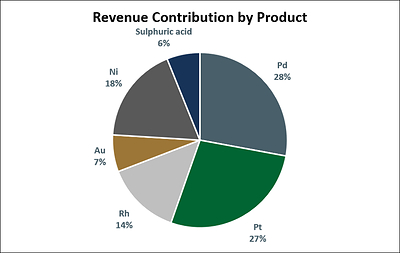
Based on the assumed PFS production schedule and the metal price deck in Table 9, Figure 10 below shows the value contribution to revenue by product produced.
Luanga Project 2026 Mineral Reserve Estimate
The PFS is based on the Company’s maiden Mineral Reserve estimate for the Project as set out below, which has an effective date of September 16, 2026.
|
Reserve |
Tonnes |
PdEq1 |
Pd |
Pt |
Rh |
Au |
Ni |
||||||
|
g/t |
Oz |
g/t |
Oz |
g/t |
Oz |
g/t |
Oz |
g/t |
Oz |
% |
Tonnes |
||
|
Proven Reserves |
17.7 |
2.99 |
1,703 |
0.95 |
541 |
0.82 |
466 |
0.12 |
70 |
0.08 |
44 |
0.1765 |
31,239 |
|
Probable Reserves |
69.0 |
2.72 |
6,028 |
0.93 |
2,062 |
0.65 |
1,442 |
0.10 |
226 |
0.07 |
161 |
0.1786 |
123,237 |
|
Total Reserves |
86.7 |
2.77 |
7,731 |
0.93 |
2,603 |
0.68 |
1,908 |
0.11 |
295 |
0.07 |
205 |
0.1781 |
154,476 |
Table 10: Luanga Project Mineral Reserve Estimate
|
Notes: |
|
|
a) |
Mineral Reserves are reported in accordance with the CIM Standards (2014) and Best Practices Guidelines (2019), as required by National Instrument 43-101 Standards of Disclosure for Mineral Projects (NI 43-101). |
|
b) |
Mineral Reserves are the economic portion of Measured and Indicated Mineral Resources. No Inferred Resource was counted as Mineral Reserve. |
|
c) |
Reserves are accounted at plant ROM pad. |
|
d) |
The Mineral Reserve Estimates have been prepared by Mr. Porfirio Cabaleiro Rodriguez, B.Sc Min. Eng., FAIG, FAusIMM, director of GE21, an independent QP under NI43-101. |
|
e) |
The Effective Date of the Mineral Reserve Estimates is September 16, 2026. |
|
f) |
Mineral Reserves block model uses a 5 m x 5 m x 5 m SMU. |
|
g) |
Mining recovery factor of 95%. Mining dilution of 7% applied in the block model. |
|
h) |
Defined cut-off grade of 0.87 g/t PdEq1. |
|
i) |
Palladium Equivalent (“PdEq“) Calculation: |
|
i. The PdEq equation is: PdEq1 = Pd g/t + F1 + F2 + F3 + F4 |
|
|
ii. Where: F1 = ((Ptp*PtR)/(Pdp*PdR)) x Ptt; F2 = ((Rhp*RhR)/(Pdp*PdR)) x Rht; F3 = ((Aup*AuR)/(Pdp*PdR)) x Aut; F4 = ((Nip*NiR)/(Pdp*PdR)) x Nit |
|
|
a. P = Metal Price |
|
|
b. R = Metallurgical Recovery |
|
|
j) |
The Mineral Reserve Estimates are reported within a designed pit, developed based on a selected pit shell generated by GEOVIA Whittle® software, using the following assumptions: |
|
i. Metallurgical recovery of 77% Pd, 81% Pt, 51% Rh, 50% Au, 62% Ni to a saleable Ni-PGM concentrate. |
|
|
ii. Independent Geotechnical Testwork – Overall pit slopes of 33° in oxide, 48° in poor quality fresh rock, 51° in medium quality fresh rock, and 55° in good quality fresh rock. |
|
|
iii. The Mineral Reserves are reported on a dry density basis. |
|
|
iv. Smelter recoveries of 99% for Pd and Pt, 95% for Rh and Au, and 98% for Ni. |
|
|
k) |
Costs: |
|
i. Mining costs: US$2.10/t oxide, US$2.90/t waste rock, and US$3.20/t fresh ore. |
|
|
ii. Processing costs: US$7.64/t. |
|
|
iii. Other costs: US$5.00/t processed for General & Administration, US$1.00/t processed for grade control, US$1.00/t processed for rehabilitation, US$4.00/t processed. |
|
|
iv. Smelting and refining: US$251.00/t concentrate for smelting and refining, and US$80.00/t concentrate for smelter G&A. |
|
|
l) |
Payable royalties of 5% (CFEM, BNDES, Vale). |
|
m) |
Metal selling prices, based on Consensus Long-Term nominal prices: US$1,271.00/oz Pd, US$1,350.00/oz Pt, US$5,000.00/oz Rh, US$3,096.00/oz Au, and US$9.07/lb Ni. |
|
n) |
The responsible QP is not aware of political, environmental, legal, title, taxation, socioeconomic, marketing, or other relevant risks that would materially affect the estimation of Mineral Reserves other than those discussed in the Technical Report to be filed within 45 days. |
|
o) |
Totals may not sum due to rounding. |
Luanga Project 2025 Mineral Resource Estimate
The Mineral Reserve used in the PFS is based upon the Company’s 2025 pit constrained Mineral Resource Estimate (“MRE“) (Table 11), which has an effective date of February 18, 2025. The PFS does not contemplate processing the Oxide component of the MRE, which would require an additional processing plant, configured for oxide material. Mineralized Oxide material would be removed and stockpiled as part of the pre-stripping stage of the open pits, for which material movement costs are assumed in this PFS.
The MRE comprises of 158 Mt grading 2.04 g/t PdEq1 (“Palladium Equivalent”) for a total of 10.4 Moz of PdEq1 in the Measured + Indicated category, and 78 Mt grading 2.01 g/t PdEq1 for 5.0 Moz PdEq1 in the Inferred category. Table 11 shows a breakdown of the MRE by tonnage, grade and metal content for each metal, weathering type, and resource classification category.
Mineral resources that are not mineral reserves do not have demonstrated economic viability. There is no certainty that all mineral resources would be converted into mineral reserves. This MRE includes Inferred Mineral Resources which have not had sufficient work to classify them as Indicated mineral resources. It is uncertain but reasonably expected that inferred mineral resources could be upgraded to indicated mineral resources with continued exploration. For further information on the MRE, please refer to the 2025 MRE NI 43-101 Independent Technical Report (SEDAR+) with an effective date of February 18, 2025.
Note that the assumed Base Case PFS production schedule is based on a subset of this 2025 MRE and applied a cut-off grade of 0.87 g/t PdEq1 to provide what Bravo deems to be an optimal return in the PFS economic model, which also excludes consideration of Oxide material at this point in time.
|
Resource |
Weathering |
Average Grades and Contained Metal Estimates |
||||||||||||
|
Tonnes |
PdEq1 |
Pd |
Pt |
Rh |
Au |
Ni |
||||||||
|
Mt |
g/t |
Oz |
g/t |
Oz |
g/t |
Oz |
g/t |
Oz |
g/t |
Oz |
% |
Tonnes |
||
|
Measured |
Oxide |
4 |
1.51 |
197 |
0.90 |
117 |
0.88 |
115 |
0.12 |
15 |
0.05 |
7 |
— |
— |
|
High talc |
— |
— |
— |
— |
— |
— |
— |
— |
— |
— |
— |
— |
— |
|
|
Fresh Rock |
32 |
2.06 |
2,144 |
0.97 |
1,009 |
0.67 |
694 |
0.08 |
88 |
0.04 |
46 |
0.11 |
35,282 |
|
|
Total |
36 |
2.00 |
2,340 |
0.96 |
1,126 |
0.69 |
809 |
0.09 |
104 |
0.04 |
53 |
0.10 |
35,282 |
|
|
Indicated |
Oxide |
6 |
1.51 |
314 |
0.97 |
200 |
0.73 |
151 |
0.11 |
23 |
0.04 |
9 |
— |
— |
|
High talc |
2 |
1.83 |
146 |
1.12 |
89 |
0.54 |
43 |
0.08 |
6 |
0.11 |
9 |
0.13 |
3,160 |
|
|
Fresh Rock |
113 |
2.09 |
7,599 |
0.99 |
3,583 |
0.59 |
2,133 |
0.09 |
318 |
0.05 |
193 |
0.14 |
156,406 |
|
|
Total |
122 |
2.06 |
8,058 |
0.99 |
3,872 |
0.59 |
2,326 |
0.09 |
348 |
0.05 |
210 |
0.13 |
159,566 |
|
|
Measured + |
Oxide |
10 |
1.51 |
510 |
0.94 |
317 |
0.79 |
266 |
0.11 |
38 |
0.04 |
15 |
— |
— |
|
High talc |
2 |
1.83 |
146 |
1.12 |
89 |
0.54 |
43 |
0.08 |
6 |
0.11 |
9 |
0.13 |
3,160 |
|
|
Fresh Rock |
145 |
2.08 |
9,743 |
0.98 |
4,592 |
0.60 |
2,827 |
0.09 |
407 |
0.05 |
239 |
0.13 |
191,688 |
|
|
Total |
158 |
2.04 |
10,399 |
0.98 |
4,998 |
0.62 |
3,135 |
0.09 |
451 |
0.05 |
262 |
0.12 |
194,848 |
|
|
Inferred |
Oxide |
3 |
1.57 |
130 |
0.88 |
73 |
1.04 |
86 |
0.13 |
11 |
0.05 |
4 |
— |
— |
|
High talc |
0.1 |
1.76 |
5 |
1.08 |
3 |
0.53 |
2 |
0.07 |
0 |
0.10 |
0 |
0.14 |
133 |
|
|
Fresh Rock |
75 |
2.02 |
4,878 |
0.97 |
2,344 |
0.58 |
1,389 |
0.08 |
191 |
0.05 |
123 |
0.13 |
97,586 |
|
|
Total |
78 |
2.01 |
5,013 |
0.97 |
2,421 |
0.59 |
1,476 |
0.08 |
202 |
0.05 |
128 |
0.13 |
97,719 |
|
Table 11: Luanga Project Mineral Resource Estimate (Inclusive of Mineral Reserves)
|
Notes to the MRE: |
|
|
a) |
The 2025 MRE was prepared by Bernardo Horta de Cerqueira Viana, Geologist, BSc (Geology), FAIG, CEO of GE21 Consultoria Mineral Ltda. and Porfírio Cabaleiro Rodriguez, Mining Engineer, BSc (Mine Eng), FAIG, CKO of GE21 Consultoria Mineral Ltda., both independent Qualified Person (“QP“) for the purposes of National Instrument 43-101 Standards of Disclosure for Mineral Projects (“NI 43-101“). The effective date of the MRE is 18 February 2025. |
|
b) |
Mineral resources are reported using the 2014 CIM Definition Standards and were estimated in accordance with the CIM 2019 Best Practices Guidelines, as required by National Instrument 43-101 Standards of Disclosure for Mineral Projects (“NI 43-101”). |
|
c) |
The MRE Estimate is reported/confined within an economic pit shell generated by Dassault Geovia Whittle software, using the following assumptions: |
|
d) |
Generated from work completed by Bravo and historical test work: |
|
i. Metallurgical recovery in sulphide material of 77% Pd, 81% Pt, 51% Rh, 48% Au, 50% Ni to a Ni-PGM concentrate. |
|
|
ii. Metallurgical recovery in oxide material of 81% Pd, 23% Pt, 54% Rh, 90% Au to a PGM ash residue (Ni not applicable). |
|
|
iii. Metallurgical recovery in high-talc sulphide material of 51% Pd, 55% Pt, 27% Rh, 27% Au, 50% Ni to a Ni-PGM concentrate. |
|
|
iv. Independent Geotechnical Testwork – Overall pit slopes of 40 degrees in oxide and 50 degrees in Fresh Rock. |
|
|
v. Densities are based on 27,170 drillhole core and 112 in situ samples density measurements. The Mineral Resources are reported on a dry density basis. |
|
|
vi. External downstream payability has not been included, as the base case MRE assumption considers internal downstream processing, with operating costs for downstream processing included in the calculation of the 0.5g/t PdEq1 cut-off used for the declared MRE. |
|
|
vii. Payable royalties of 2%. |
|
|
e) |
Metal Pricing |
|
i. For the 2025 MRE, the same pricing regime was used as in the 2023 MRE as there have been no significant changes in prices. This also allowed for a direct comparison between the 2025 MRE and the superseded 2023 model (a 10-year trailing average – 2014-2023): Pd price of US$1,380/oz, Pt price of US$1,100/oz, Rh price of US$6,200/oz, Au price of US$1,500/oz, Ni price of US$7.10/lb. |
|
|
p) |
Palladium Equivalent (“PdEq“) Calculation: |
|
iii. The PdEq equation is: PdEq1 = Pd g/t + F1 + F2 + F3 + F4 |
|
|
iv. Where: F1 = ((Ptp*PtR)/(Pdp*PdR)) x Ptt; F2 = ((Rhp*RhR)/(Pdp*PdR)) x Rht; F3 = ((Aup*AuR)/(Pdp*PdR)) x Aut; F4 = ((Nip*NiR)/(Pdp*PdR)) x Nit |
|
|
a. P = Metal Price |
|
|
b. R = Metallurgical Recovery |
|
|
f) |
Costs were taken from comparable projects in GE21’s extensive database of mining operations in Brazil, which includes not only operating mines, but recent actual costs from what could potentially be similarly sized operating mines in the Carajás. Costs considered a throughput rate of ca. 10Mtpa. |
|
i. Mining costs: US$2.00/t oxide, US$3.00/t Fresh Rock. Processing costs: US$9.00/t fresh rock, US$7.50/t oxide. US$1.50/t processed, for General & Administration. US$1.00/t processed for grade control. US$0.50/t processed for rehabilitation. |
|
|
ii. Several of these considerations (metallurgical recovery, metal price projections for example) should be regarded as preliminary in nature, and therefore PdEq1 calculations should be regarded as preliminary in nature. |
|
|
g) |
The 2025 MRE supersedes and replaces the Previous Estimate (2023), which should be no longer relied upon. |
|
h) |
The QP is not aware of political, environmental, or other risks that could materially affect the potential development of the Mineral Resources other than those typical for mining projects at this stage of development, including those listed in the Technical Report dated October 22nd, 2023, and in the Company’s Annual Information Form dated April 22nd, 2024. |
|
i) |
Totals may not sum due to rounding. |
Project Opportunities
Alternate Development Scenarios
In addition to the Base Case, the PFS financial model was used to evaluate three additional alternative project configurations. These alternatives are summarised in Table 12 for information purpose only; the Base Case and Alternate Case A have been completed to AACE Class 4 status and thus form part of the PFS.
The additional Alternate Case B and Opportunities Case do not for part of the Class 4 PFS but will be included in the Technical Report as Other Relevant Data and Information as contemplated in Item 24 of NI 43-101F1.
- Alternate Case A:
- Alternate Case A contemplates the same mine and concentrator development schedule and production scale as the Base Case, while considering a staged development of the smelter within the Barcarena ZPE. The purpose of this scenario is to evaluate the potential to reduce initial capital requirements and upfront funding needs during the early years of Project development, while assessing the extent to which subsequent stages of the smelter development could be funded from internally generated cash flow.
- Alternate Case B:
- Alternate Case B contemplates development of the operation at a more modest scale and lower CAPEX, with a mining schedule, concentrator and smelter within the Barcarena ZPE designed to accommodate a peak production rate of 5 Mtpa, compared with 10 Mtpa under the Base Case. Equipment capital cost estimates were scaled accordingly using standard industry factorisation methods, including the Six-Tenths Rule. As noted above, this case is developed to a PEA level.
- Opportunity Case
- A study was conducted to evaluate the potential impact on the Luanga Project should additional Mineral Resources currently classified as Inferred be converted to the Measured and Indicated categories through future drilling and, subject to the application of appropriate modifying factors, potentially support an increase in Mineral Reserves.
- For this purpose, a separate pit optimisation, mine design and production scheduling exercise was undertaken using the entire current MRE block model and applying the same updated modifying factors, inputs and assumptions used in the PFS Base Case. A separate economic model was then developed using the same economic and financial parameters as the PFS Base Case to assess the potential impact of such additional material on the Project’s mine life, production profile and economics. As noted above, this case is developed to a PEA level.
|
Indicator |
Base Case |
Alternate Case A |
Alternate Case B |
Opportunity Case* |
|
Description |
Base Case: open pit |
Mine and concentrator |
Base case configuration |
Updated 2026 PFS |
|
Study Class (AACE) |
Class 4 |
Class 4 |
Class 5 |
Class 5 |
|
Study Status |
Prefeasibility Study |
Prefeasibility Study |
PEA |
PEA |
|
Mine Life (years) |
9.6 |
9.6 |
20 |
13 |
|
Total Ore Mined / Reserve Processed, LOM (Mt) |
86.7 |
86.7 |
86.8 |
123.3 |
|
Total Waste Mined, LOM (Mt) |
576.1 |
576.1 |
544.0 |
781.9 |
|
Strip Ratio (t/t) |
6.64 |
6.64 |
6.27 |
6.34 |
|
Peak Mining Rate (Mtpa) |
82.0 |
82.0 |
41.6 |
104.0 |
|
Peak Plant Throughput (Mtpa) |
10.03 |
10.03 |
5.00 |
10.00 |
|
Total Payable Pd, LOM (kOz) |
2,088.9 |
2,031.8 |
2,069.8 |
2,912.1 |
|
Total Payable Pt, LOM (kOz) |
1,507.5 |
1,463.9 |
1,495.2 |
1,985.2 |
|
Total Payable Rh, LOM (kOz) |
160.7 |
155.7 |
159.6 |
207.1 |
|
Total Payable Au, LOM (kOz) |
180.9 |
174.6 |
181.0 |
229.4 |
|
Total Payable Ni, LOM (t) |
98.2 |
93.7 |
99.2 |
128.0 |
|
4E PGM Avg. Annual Prod. (kOz) |
393.9 |
382.7 |
195.3 |
410.3 |
|
Initial (Upfront) CAPEX (US$M) |
785 |
604 |
491 |
785 |
|
Sustaining CAPEX, LOM (US$M) |
124 |
291 |
124 |
124 |
|
Total CAPEX, LOM (US$M) |
909 |
894 |
615 |
909 |
|
After-tax NPV (US$M) |
1,449 |
1,214 |
1,151 |
1,777 |
|
After-tax IRR (%) |
35.1 % |
31.5 % |
30.6 % |
32.0 % |
|
Payback, post-tax (years) |
2.0 |
2.5 |
2.5 |
2.5 |
|
C1 Cash Cost (US$/oz 4E PGM) |
$478 |
$526 |
$488 |
$509 |
|
AISC (US$/oz 4E PGM) |
$706 |
$797 |
$718 |
$729 |
Table 12: Comparison of PFS Base Case, Alternative Case A, Alternative Case B and the Opportunity Case*
*CAUTIONARY STATEMENT REGARDING THE OPPORTUNITY CASE
For the purposes of NI 43-101, the Alternative Case B and the Opportunity Case constitute Preliminary Economic Assessments (“PEA”) and is identified as such wherever it is referred to in this news release and in the Technical Report, consistent with the guidance in CSA Staff Notice 43-307 “Mining Technical Reports – Preliminary Economic Assessments”, which cautions issuers against blurring the boundary between a PEA and a pre-feasibility study. The Alternate Case B or the Opportunity Case does not form part of the Pre-Feasibility Study (“PFS”) reported herein and are included in the PFS Technical Report as Other Relevant Data and Information pursuant to Item 24 of Form 43-101F1.
Readers are cautioned to consider the following in interpreting the Opportunity Case:
- Purpose. The Opportunity Case has been developed solely to illustrate the potential economic effect on the Luanga Project of a hypothetical future conversion of a portion of the currently estimated Inferred Mineral Resources to the Measured and Indicated categories and, subject to the appropriate modifying factors, to mineral reserves, and to assist the Company in assessing whether further Mineral Resource and Mineral Reserve definition drilling is technically and commercially warranted. It is not, and is not intended to be, a basis for investment decisions.
- Speculative nature of Inferred Mineral Resources. The Opportunity Case incorporates Inferred Mineral Resources in its production profile and economic analysis, as permitted for a PEA by section 2.3(3) of NI 43-101. Consistent with section 3.4(e) of NI 43-101, the economic viability of the Mineral Resources referred to in the Opportunity Case has not been demonstrated. Inferred Mineral Resources are considered too speculative geologically to have the economic considerations applied to them that would enable them to be categorized as Mineral Reserves, and there is no certainty that the Opportunity Case, or any part of it, will be realized. There is no guarantee that any or all of the Inferred Mineral Resources referred to in the Opportunity Case will be upgraded to Measured or Indicated Mineral Resources, whether upon completion of the Company’s ongoing infill drilling programme and the anticipated resulting update to the Mineral Resource estimate, or at any subsequent time.
- No Mineral Reserves declared; not part of the PFS. The Opportunity Case does not declare, and is not to be construed as declaring, any Mineral Reserves. Section 2.3(1)(b) of NI 43-101 does not permit Inferred Mineral Resources to be included in a pre-feasibility study level economic analysis, and no such use has been made in the PFS reported herein.
- No certainty of eventual conversion to Mineral Reserves. Even if all or part of the Inferred Mineral Resources referred to in the Opportunity Case were in the future upgraded to Measured or Indicated Mineral Resources, there is no certainty that any or all of the resulting Measured and Indicated Mineral Resources would be converted, in whole or in part, to Mineral Reserves under the modifying factors applicable at that time.
Additional Opportunities
- MRE / Reserve Growth Potential
- The Risks and Opportunities Analysis as set out in the 2025 PEA of the Luanga Project concluded that a significant opportunity exists at the project to increase mineral resources at the project and recommended further drilling and expanded exploration.
- Bravo’s 2026 field programme, announced on 18 February 2026, was designed in response to these recommendations. The Company has budgeted 28,000 metres of drilling, of which approximately 22,000 metres is infill and extensional drilling at the Luanga deposit and approximately 6,000 metres is directed at regional and deep targets. The infill component targets the conversion of Inferred Mineral Resources to the Measured and Indicated categories, subject to consideration of other modifying factors.
- Drilling completed after the effective date (February 18, 2025) of the Mineral Resource estimate on which this Prefeasibility Study is not reflected in the Mineral Reserve or economic figures reported above.
- As announced, Bravo has since extended the drill-defined Main Sulphide Zone to approaching 350 metres below surface in the Central Sector, to approximately 200 metres in the North Sector, and to shallower depths in the Southwest Sector. Deeper drilling in the Central Sector has returned mineralized thicknesses equal to or greater than those encountered in shallower drilling, with PGM+Au grades generally comparable to or higher than those above and sulphide nickel grades increasing with depth.
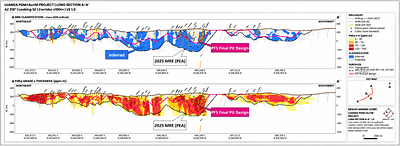
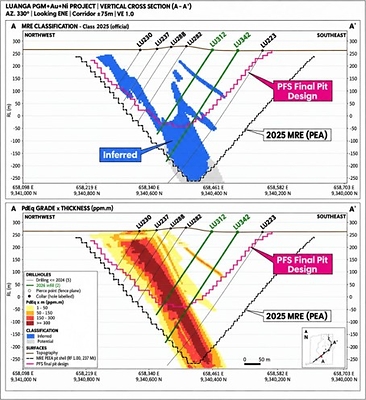
Mineralization remains open below the current base of drilling along essentially the full 8.1-kilometre strike length of the Luanga Complex and, based on the Company’s interpretation, at depths potentially reachable by open-pit mining. The North and Southwest Sectors are the less drilled sectors of the three. The North Sector is defined only to about 200 metres below surface in a setting that the Central Sector shows to be mineralized well below 300 metres and, in the Southwest Sector, the constraining pit shell reaches the limit of the drilling data, with further mineralized zones present higher in the stratigraphic sequence. - Figures 11 and 12 below shows the 2025–2026 infill drilling completed to date, after the date of the current MRE. The current MRE was estimated using a database comprising 531 drill holes for a total of 108,343 metres (including 8,714m of trenching). An additional 81 drill holes, or 22,100 metres, are planned for inclusion in the next Mineral Resource update, targeted for Q1 2027, of which 69 holes, or 19,227 metres, have been completed to date.
- Copper Revenues Relating to the Luanga PGM Deposit
- Copper has not historically been included in the Project’s Mineral Resource Estimate, as its grade and contribution to overall project economics have been assessed as immaterial. Copper is nonetheless present within the mineralised system and has been analysed as a matter of routine throughout metallurgical test work to date, with both feed material and final concentrate assayed for copper content and copper recovery to concentrate determined alongside the other elements under test.
- Test work completed to date has demonstrated copper recoveries to concentrate consistently ranging from 89% to 95%, with copper grades of 2% to 3% in the final concentrate. Applying a long-term consensus mean copper price of US$10,516 per tonne and an assumed 80% smelter payable, the recovered copper could potentially generate approximately US$29 million to US$43 million of additional annual revenue, or approximately US$290 million to US$430 million over the life of mine, with no associated increase in operating costs. No value attributable to this copper credit has been incorporated into the PFS Base Case economic analysis and, accordingly, it represents a potential upside opportunity for the Project.
- Bravo intends to evaluate options for incorporating copper into a future Mineral Resource Estimate for the Project, potentially through a combination of additional systematic copper sampling and statistical grade-estimation methods. Of the approximately 137,500 sample intervals held in the Project’s drill database, copper has been assayed in only around 57%, with assay coverage differing markedly between historical Vale-era drilling (approximately 99% assayed for copper) and Bravo’s own drilling (approximately 34%).
- Vertical Integration Flexibility
- Vertical integration of the project substantially improves the NSR for metal contained in concentrate through lower treatment costs, logistics costs final payables.
- The 10-to-1 reduction in mass resulting from smelting the concentrate to a metal alloy greatly reduces the Company’s exposure to volatility and potential escalation in maritime shipping costs and potential cost escalation, while also reducing the Project’s carbon footprint accordingly.
- The additional redundant processing capacity in the current smelter design may present an opportunity for the Project to investigate further improving concentrator metal recoveries by reducing flotation selectivity. Improved recoveries at lower target concentrate grades may further positively impact on overall project economics, particularly within the low operating cost environment of the ZPE.
- Alternatively, the excess capacity may provide opportunities for processing of third-party Ni or PGM concentrates within the ZPE.
- Owner’s Mining Fleet
- The economic benefit of contemplating an owned mining fleet relative to utilising a contractor fleet was reviewed in a trade-off study.
- The study concluded that mine unit costs could be reduced by up to 43% with a preliminary additional upfront capital cost of approximately US$91.5 million and a sustaining cost of US$361 million over the life of mine.
- An owner’s fleet was not adopted in the current base case due to the reduced LOM but will be considered for the next phase of study where a more detailed trade-off study is contemplated, including hybrid fleet scenarios.
- The eventual adoption of an owner’s fleet model (or hybrid model) may present an opportunity to reduce the operational C1 cash cost.
- Oxide Mineral Resources
- Oxide mineralised material remains excluded from the Base Case.
- Metallurgical testing suggests potential for economic recoveries exits. Further test work is planned and, if incorporated into future studies, would require additional plant components not considered in this PFS.
- IOCG-Style Discovery
- Recent copper-gold discoveries on the Project, outside of the Luanga Deposit, are not factored into the PFS and may present additional opportunities.
Luanga Project Permitting Status
On March 3, 2025, the Pará State Environmental Agency (SEMAS) granted the Preliminary Licence (“LP”) for the Luanga Project following approval of the Project’s Environmental Impact Assessment and Environmental Impact Report (“EIA/RIMA”) and completion of the public consultation process. The LP confirms the environmental viability of the Project’s location and development concept.
The Brazilian environmental permitting process consists of three principal stages: (i) Preliminary Licence (“LP”): Granted on March 3, 2025; (ii) Installation Licence (“LI”): Authorizes construction and installation of the Project and; (iii) Licence to Operate (“LO”): Authorizes commencement of operations following completion of construction and compliance with permitting conditions.
Key permitting milestones and status include:
- The PFS provides the technical basis supporting the Installation Licence (“LI”) application.
- The Company has completed a competitive procurement process and selected the environmental consultancy responsible for preparing the studies and documentation required for the LI application.
- The Company remains in full compliance with all conditions attached to the LP, with environmental monitoring programs and required management plans being implemented within the timelines established by SEMAS.
- Ongoing technical engagement with SEMAS/PA has enabled the Project team to address technical matters proactively and anticipate potential requests for supplementary information during the LI review process.
- The LI application is targeted for submission by the end of Q4 2026.
- Based on the progress achieved to date and continued compliance with LP conditions, the Company believes the Project remains well positioned to advance to the Installation Licence stage in accordance with its targeted schedule.
Smelter Permitting Status
On August 25, 2026, Brazil’s National Council for Export Processing Zones (“CZPE”) formally authorized Bravo Metals Ltda. (“Bravo Metals”), a wholly owned subsidiary of the Company, to establish its approved industrial project within the Barcarena Export Processing Zone (“Barcarena ZPE”) and manufacture nickel-PGM mattes/alloys comprising platinum, palladium, rhodium, nickel, copper and cobalt.
The authorization, published on September 1, 2026, through Resolution CZPE/MDIC No. 128, followed the CZPE’s November 2025 approval of Bravo Metals as the ZPE’s anchor industrial project and the formal creation of the Barcarena ZPE by Presidential Decree No. 12,823 in January 2026.
The Resolution provides Bravo Metals access to the ZPE tax, foreign exchange and administrative regime for a period of 20 years, subject to applicable legislation and regulations, including suspension of certain federal taxes on imported equipment and inputs and domestic purchases, as well as certain import and export licensing benefits. The CZPE authorization is specific to Bravo Metals’ establishment and approved activities within the Barcarena ZPE and is separate from the environmental licences and other permits required for construction and operation of the proposed facilities.
SUDAM and ZPE Tax Benefit
Companies located in the Legal Amazon region may benefit from certain tax incentives under the SUDAM regime, comprising a reduction of 75% off the regular corporate income tax (25%), available for an initial period of 10 years of operation. The PFS assumes that the Luanga Project would be eligible for SUDAM tax exemption, but this can only be confirmed once an application has been submitted and approved.
Brazil’s ZPE regime, governed by Lei 11.508/2007 as modernised by Lei 14.184/2021, is a tributary, exchange and administrative package rather than an income-tax holiday. Its core is suspension of the federal taxes levied on imports and domestic purchases of machinery, apparatus, instruments, equipment, raw materials, intermediate products, packaging materials and services (Imposto de Importação, IPI, PIS/Pasep, COFINS, PIS/COFINS-Importação and the AFRMM merchant-marine freight levy) with suspension converting, once the export or production commitment is met, into a zero rate for PIS/COFINS and IPI after two years and outright exemption from Import Duty and AFRMM after five years; domestic suppliers sell into the ZPE under export treatment, so no cascading tax is embedded in the delivered cost and no recoverable credits accumulate.
At the state level, Convênio ICMS 99/1998 provides an ICMS exemption on imports and domestic purchases, while allowing companies to maintain related tax credits. Additional ICMS benefits may also be available at the state level. The authorization secures these benefits for up to 20 years, renewable for successive equal periods, while Brazil’s recently approved consumption tax regime provides equivalent treatment for the IBS (Tax on Goods and Services) and CBS (Contribution on Goods and Services) under Complementary Law No. 214/2025.
ZPE companies also benefit from simplified import licensing and customs procedures, while remaining subject to applicable health, national-security and environmental controls. Export proceeds may be retained abroad in full. Law 14,184/2021 eliminated the former 80% minimum export requirement, allowing sales into the Brazilian domestic market; however, such sales are subject to ordinary Brazilian taxes, including previously suspended taxes and applicable interest.
About Bravo Mining Corp.
Bravo is a Canadian and Brazil-based mineral exploration and development company focused on advancing its PGM, nickel and copper-gold Luanga Project in the Carajás Mineral Province, Pará State, Brazil. Bravo is one of the most active explorers in Carajás.
The team, comprising of local and international geologists, has a proven track record of PGM, nickel, and copper discoveries in the region. They have successfully taken a past IOCG greenfield project from discovery to development and production in the Carajás.
The Luanga Project is situated on mature freehold farming land and benefits from being located close to operating mines and a mining-experienced workforce, with excellent access and proximity to existing infrastructure, including road, rail, and hydroelectric grid power. Bravo’s current Environmental, Social and Governance activities include planting more than 56,000 high-value trees in and around the project area and hiring and contracting locally.
Technical Disclosure and Qualified Persons
The scientific and technical information in this news release has been reviewed and approved by Porfírio Cabaleiro Rodriguez, Mining Engineer, BSc (Mine Eng), FAIG, CKO of GE21 Consultoria Mineral Ltda., and Bernardo Horta de Cerqueira Viana, Geologist, BSc (Geology), FAIG, CEO of GE21 Consultoria Mineral Ltda., lead authors and independent Qualified Persons, as defined under NI 43-101.
Bernardo Horta de Cerqueira Viana, Geologist, BSc (Geology), FAIG, CEO of GE21 Consultoria Mineral Ltda. and Porfírio Cabaleiro Rodriguez, Mining Engineer, BSc (Mine Eng), FAIG, CKO of GE21 Consultoria Mineral Ltda., both are an Independent QP as defined in NI 43-101 and are responsible for the PFS. Independent peer reviews were carried out internally within the GE21 Group, over the complete PFS process.
Mr. Cabaleiro has reviewed and approved the scientific and technical information related to the PFS contained in this news release.
|
NI 43-101 Item |
Qualified Person / Firm |
|
1 |
Multiple QPs, GE21 |
|
2 – 12 |
Bernardo Viana, GE21 |
|
13 |
Paulo Bergmann, GE21 |
|
14 – 15 |
Porfirio Cabaleiro, GE21 |
|
16 |
Porfirio Cabaleiro, GE21 and Luis Navarro, Independent Consultant |
|
17 |
Paulo Bergmann, GE21 and Rodney Jones, Independent Consultant |
|
18 |
Porfirio Cabaleiro and Paulo Bergmann, GE21 |
|
19 |
Porfirio Cabaleiro, GE21 |
|
20 |
Branca Horta, GE21 |
|
21 – 24 |
Porfirio Cabaleiro, GE21 |
|
25 – 27 |
Multiple QPs, GE21 |
Table 13: List of Qualified Persons per Item of Responsibility.
Technical information in this news release has been reviewed and approved by Simon Mottram, F.AusIMM, President of Bravo Mining Corp., who serves as the Company’s overall “qualified person” as defined in NI 43-101. Mr. Mottram has verified the technical data and opinions contained in this news release.
Details of the PFS will be provided in a technical report with an effective date of September 16, 2026, prepared in accordance with NI 43-101, which will be filed under the Company’s SEDAR+ profile within 45 days of this news release.
Neither TSX Venture Exchange nor its Regulation Services Provider (as that term is defined in policies of the TSX Venture Exchange) accepts responsibility for the adequacy or accuracy of this release.
Forward Looking Statements
This news release contains “forward-looking information” within the meaning of applicable Canadian securities laws. Forward-looking information is not comprised of historical facts and is generally, but not always, identified by words such as “plans”, “targets”, “expects”, “is expected”, “budget”, “schedule”, “estimates”, “forecasts”, “outlook”, “intends”, “anticipates”, “believes”, “assumes”, “potential”, “opportunity”, variants of these words and other similar words, phrases, or statements that certain events or conditions “may”, “could”, “should”, “will”, “would” and similar expressions.
Forward-looking information in this news release includes, among other things, statements regarding: the results, assumptions and conclusions of the PFS, included PEAs, and the Mineral Reserve estimate, and the Mineral Resource estimate on which these are based; the potential future economic and technical performance of the Luanga Project; projected production, timing, recoveries, operating and capital costs, cash costs, AISC, revenues, cash flows, NPV, IRR and payback; the potential future development, construction, commissioning and operation of the mine, concentrator and proposed Barcarena ZPE smelter; the availability and benefits of the ZPE fiscal, customs and administrative regime and the SUDAM provisions in respect of Luanga; the sourcing of renewable electricity; the production and sale of metal alloy and sulphuric acid; the timing and outcome of environmental licensing and other regulatory approvals; the timing, results of and completion of future engineering and a Definitive Feasibility Study; the timing, results and impact of ongoing and future drilling and the targeted Q1 2027 Mineral Resource update; the potential conversion of Inferred Mineral Resources to Measured and Indicated Mineral Resources and ultimately to Mineral Reserves; the potential for mine-life extension and Mineral Resource and Mineral Reserve growth; the potential economic contribution of copper, self-mining and other Project opportunities; the results and potential implementation of Alternate Case A, Alternate Case B and the Opportunity Case; the availability and terms of potential project financing, including potential funding from Brazilian development institutions; commodity prices, exchange rates and other economic assumptions; and the timing of, and the Company’s ability to advance the Project toward, a future construction decision.
Forward-looking information is based on management’s current expectations, estimates, assumptions and beliefs, including assumptions regarding the accuracy of the PFS and included PEAs, and Mineral Resource and Mineral Reserve estimates; metallurgical recoveries; metal prices and exchange rates; capital and operating costs; availability of equipment, labour, power, water, infrastructure and financing; the ability to obtain and maintain required permits and approvals; the continued availability of ZPE and other fiscal incentives, including SUDAM eligibility; the results of future drilling, engineering and metallurgical test work; and general business, economic and market conditions. Although the Company considers these assumptions reasonable as of the date of this news release, they are inherently subject to significant business, economic, technical, regulatory and competitive uncertainties and contingencies.
Forward-looking information involves known and unknown risks, uncertainties and other factors that may cause actual results, performance or achievements to differ materially from those expressed or implied by such information. These risks include, without limitation, risks relating to the accuracy of Mineral Resource and Mineral Reserve estimates; the speculative nature of Inferred Mineral Resources; changes to modifying factors and PFS assumptions; exploration, drilling, metallurgical, engineering, construction and commissioning results; cost escalation and inflation; commodity price and foreign exchange fluctuations; financing availability and terms; permitting and regulatory delays; environmental and social risks; the design, construction and operation of the proposed smelter; availability of infrastructure, power and other inputs; changes to tax, customs, ZPE or other applicable regimes; marketability and payability of concentrates and alloy products; and the other risks inherent in mineral exploration, development and mining.
There can be no assurance that forward-looking information will prove to be accurate, as actual results and future events could differ materially from those anticipated. Readers are cautioned not to place undue reliance on forward-looking information. The Company undertakes no obligation to update or revise any forward-looking information, whether as a result of new information, future events or otherwise, except as required by applicable securities laws.
Cautionary Note for U.S. Investors Concerning Mineral Resources, Mineral Reserves and the PFS
This news release has been prepared in accordance with the requirements of the securities laws in effect in Canada, which differ from the requirements of United States securities laws. The terms “mineral resource”, “measured mineral resource”, “indicated mineral resource”, “inferred mineral resource”, “mineral reserve”, “proven mineral reserve” and “probable mineral reserve” are defined in and required to be disclosed by NI 43-101. While the terms “mineral reserve”, “proven mineral reserve” and “probable mineral reserve” are recognised and required by Canadian regulations and are similarly recognised under the U.S. Securities and Exchange Commission (“SEC”) modernization rules known as “S-K 1300”, investors are cautioned that mineral resource and mineral reserve estimates prepared under NI 43-101 may not in all cases be identical to estimates prepared in accordance with S-K 1300. Investors are cautioned not to assume that all or any part of a “measured mineral resource”, “indicated mineral resource” or “inferred mineral resource” will ever be upgraded to a higher category or converted into a mineral reserve. “Inferred mineral resources” have a great amount of uncertainty as to their existence, and great uncertainty as to their economic and legal feasibility. Under Canadian rules, estimates of inferred mineral resources may not form the basis of feasibility or pre-feasibility studies, except in rare cases, and none has been included in the Base Case production schedule described in this news release.
Non-IFRS Financial Performance Measures
“All-in Sustaining Cost”, “Total Site Costs”, “Total Operating Costs”, “C1 Cash Cost”, “Net Revenue” and “Free Cashflow” are not performance measures reported in accordance with International Financial Reporting Standards (“IFRS”). These performance measures are included because these statistics are key performance measures that management uses to monitor performance and to assess the Luanga Project against peer projects. These performance measures do not have a meaning within IFRS and, therefore, amounts presented may not be comparable to similar data presented by other mining companies. These performance measures should not be considered in isolation as a substitute for measures of performance in accordance with IFRS.

SOURCE Bravo Mining Corp.
