Paradigm Capital explains why we’re having a healthy market correction, not a crash

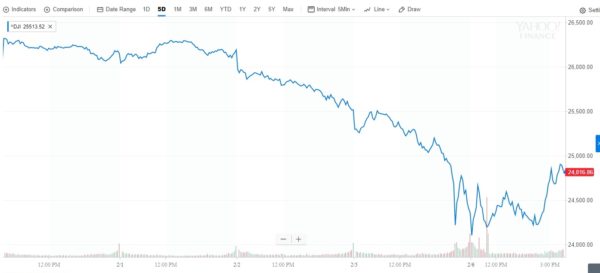
Stock market watchers worldwide are fearing the worst after the recent deep plunge, one which began last week and then clearly hit its stride on Monday, capped by a 1,175-point drop in the Dow Jones —the largest one-day drop in six and a half years.
In Canada, the S&P/TSX composite index was down 271.22 point to 15,334.81 on Monday, while the dollar dropped two-thirds of a cent.
And while numbers Tuesday showed signs of a halt to the sell-off, after years of record gains investors are rightly nervous that something more than a correction is in the works. Comparisons are even being made to the crash of 2008, when the Dow fell 800 points during trading hours on October 6th, a 7.7 per cent drop (Monday’s numbers were down 6.26 per cent at their peak).
But fear not, says Kevin Archibald of Paradigm Capital, who in a technical review Monday pointed to a number of indicators that suggest we’re dealing with a correction, not a crash.
Breaking down the evidence, first, although the Volatility Index (VIX), a measure of expected volatility based on CBOE option prices, did climb to 28.5 per cent last week, a broader comparison of VIX to VXV (1-month volatility expectation vs. 3-months) shows an inversion, which suggests that future volatility will decline.
Secondly, the bond markets show that the ratio of the High Yield Bond Fund (HYG) to the US Treasury Bond Fund is currently signalling that credit spreads are narrowing rather than widening. This is an indication of greater rather than less risk appetite, says Archibald.
“If this was a major top developing in the broader market, the bond market would provide a warning signal via a widening in credit spreads (i.e. breakdown in the HYG:TLT ratio),” says the analyst. “We are simply not seeing this.”
Thirdly, Archibald points to another breadth indicator, the NYSE Advance Decline Line, which since the 1960s has trended negatively whenever the broader market hits its major top. But right now, the NYAD is reaching all time highs.
All told, the numbers signal a near-term correction rather than something more drastic, says Archibald. “With momentum indicators extremely stretched to the upside as prices hit the top of the channel, it should not come as a surprise that we are seeing weakness,” says the analyst. “However, based on a number of indicators, we view this pullback as a healthy correction to alleviate an overbought condition within an ongoing bullish market.”