
Welcome to the first installment in our “Head to Head” series. In “Head to Head” we
use basic value metrics to compare a large Canadian tech stock to a small one in a
similar space. Clearly, there are caveats and
qualifiers necessary (growth, for instance is much more important to smaller stocks)
in such a comparison. Nonetheless, we think it’s a useful exercise to try and level
the playing field to see if David can take down Goliath. In the first matchup,
upstart OSI Geospatial (TSX:OSI) plays the role of David against the Goliath that is
MacDonald Dettwiler (TSX:MDA).
First,a little about the pugilists: Founded in 1977, Ottawa based OSI Geospatial
(OSI) develops and sells “command and control” technologies and navigation systems
for the defense and homeland security markets. In the past four quarters, to May
31st, 2009 OSI’s revenue was $26.4 million.
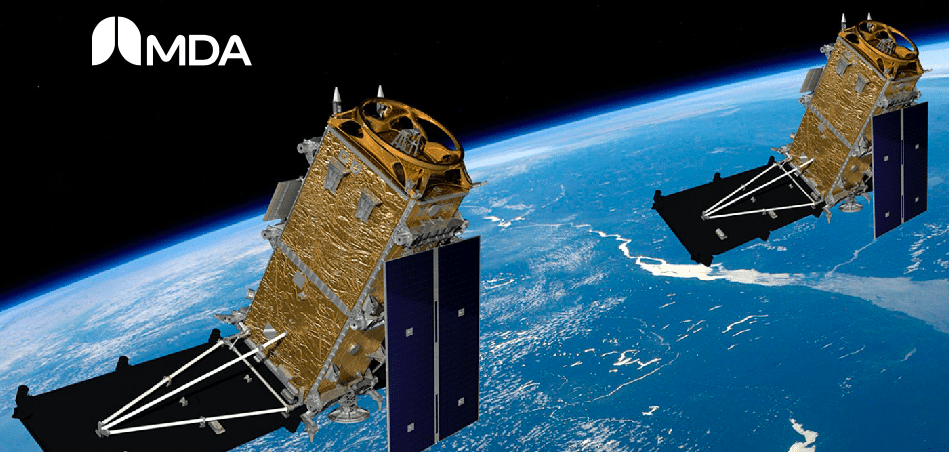
Richmond, BC based Macdonald Dettwiler and Associates (MDA) was founded in 1969. MDA
is a diverse provider of information solutions. One of the company’s key units
provides geospatial information systems for aerospace and defense industries. In the
trailing four quarters, to June 30th, 2009 MDA did $1.074 billion in revenue.
Let’s get started by seeing how these two from opposite ends of the weight class
fare in the most basic of tests, price to sales:
1. Price to sales:
OSI 0.30
MDA: 1.18
A big difference here; OSI’s market cap of 8.04 million (47.28 million shares
outstanding multiplied by the closing share price at September 18, 2009, which was
.17 cents) pales in comparison to its trailing revenues of 26.4 milion. This price
to sales ratio of 0.30 would put OSI in the top third of all DVC Smalltech profiled
companies. MacDonald Dettwiler, on the other hand has nearly doubled off its October
2008 lows of approximately $16 and now trades above one times sales again. MDA’s
market cap is now 1.27 billion (40.47 million shares multiplied by a closing share
price of $31.31 on September 18th, 2009)while its revenue in the trailing four
quarters was $1.07 billion.
2. Cash and Short term investments to market cap:
OSI: 6.3%
MDA: 2.97%:
When compared to their market caps, Neither OSI nor MacDonald Dettwiler could be
called cash rich. With just $510,000 in cash and short term investments as of May
31st, 2009 OSI has just 6.3% in the bank. But MDA falls even shorter. With just
37.68 million in the bank as of June 30th, 2009 MDA has just 2.97% of their market
cap at hand.
3. Debt to market cap:
OSI: Zero
MDA: 34.1%
OSI, like many of the DVC Smalltech Letter profiled stocks carried no long term debt
as of May 31st, 2009. MDA, on the other hand, might be described as “debt-laden”. On
June 30th, 2009 MDA reported just over $432 million in long term debt, or just over
34% of its market cap. Of course many would argue that MDA wouldn’t be a heavyweight
at all if it couldn’t access and manage a large debt load.
4. Trailing three year growth rate:
OSI: 35.5%
MDA: 12.6%
MDA has done a lot of growing since 1969 and, considering its size, that double
digit growth rate is impressive. MDA grew from just over $832 million in revenue in
2005 to $1.16 billion in 2008. In actual dollars, OSI’s growth is pocket change to
MDA, but a 35.5% annualized growth rate over three years is impressive regardless of
the size of the company. That number would place OSI in the top third of all DVC
Smalltech Letter profiled companies.
5. Enterprise Value to Sales:
OSI 28.5%
MDA 155%
Enterprise value is the really the metric that answers the question “How much love
does the market have for your company?”. Unfortunately for OSI at this time, as with
many small Canadian techs, the answer is “not much”. Here we compare each companies
Enterprise Value (The formula for calculating EV is Market Cap + debt – Cash and
short term investments). and express it as a percentage of their sales. The market
gives OSI an Enterprise value of just over $7.5 million, while sales from their
trailing four quarters were 26.4 million. OSI certainly has a lot of room to grow
into the public profile of MDA, whose EV clocks in at just over 1.6 billion, while
sales from the trailing 4Q’s totaled just $1.07 billion.
Leave a Reply
You must be logged in to post a comment.


 Share
Share Tweet
Tweet Share
Share



Comment