
New Pacific Metals Reports Results of Updated Carangas Preliminary Economic Assessment: Post-tax $2.65 Billion NPV (5%) and 35.9% IRR; 339.0 Million Oz of Silver Equivalent Produced
VANCOUVER, BC, July 16, 2026 /CNW/ — New Pacific Metals Corp. (TSX: NUAG) (NYSE-A: NEWP) (“New Pacific” or the “Company”) is pleased to report the results of its updated preliminary economic assessment technical report titled “Carangas Project NI 43-101 Technical Report and Preliminary Economic Assessment” (the “Updated Carangas PEA Technical Report”) for the Carangas project (the “Project”) in Oruro Department, Bolivia prepared in accordance with National Instrument 43-101 – Standards of Disclosure for Mineral Projects (“NI 43-101”) by Ausenco Engineering Canada ULC (“Ausenco”) dated effective July 16, 2026. The Updated Carangas PEA Technical Report considers an increased throughput rate and the inclusion of the gold zone when compared to the previous Preliminary Economic Assessment technical report dated September 5, 2024. Highlights from the Updated Carangas PEA Technical Report are as follows (all figures in US Dollars):
- Post-tax net present value (“NPV”) (5%) of $2.65 billion and internal rate of return (“IRR”) of 35.9% at base case metal prices of: $45.00/ounce (“oz”) silver (“Ag”), $3,400/oz gold (“Au”), $1.20/pound (“lb”) zinc (“Zn”), and $0.90/lb lead (“Pb”);
- Post tax NPV and IRR of $4.16 billion and 51.5%, respectively, at $67.50/oz Ag and the other metal prices held constant;
- Post tax NPV and IRR of $3.23 billion and 37.0%, respectively, at $5,100/oz Au and the other metal prices held constant;
- 19-year life of mine (“LOM”), excluding two-years of pre-production, producing approximately 195 million oz (“Moz”) of payable Ag, 1.1 Moz of payable Au, 1,453 million pounds (“Mlbs”) of payable Zn and 941 Mlbs of payable Pb, or 339.0 Moz silver equivalent (“AgEq”1);
- Mining will occur during years 1 through 16. For years 17 to 19 all production will come from stockpiles;
- Payable silver production of approximately 15.5 Moz per year (18.9 Moz AgEq per year) in years 1 through 8, the “pre-gold production period”; average all-in sustaining cost (“AISC”) of $18.25/oz AgEq, or average AISC of $12.11/oz Ag, net of by-products, during the pre-gold production period;
- Payable silver production of approximately 7.6 Moz per year and payable gold production of approximately 142.7 thousand ounces (“koz”) per year (20.7 Moz AgEq per year) from years 9 through 16, the “gold production period”; average AISC of $17.78/oz AgEq, or average AISC of $-39.49/oz Ag, net of by-products, during the gold production period;
- Payable silver production of 10.3 Moz total (21.6 Moz AgEq total) for years 17 to 19, the “stockpile period”; and
- Average LOM AISC of $19.16/oz AgEq, or average LOM AISC of $0.11/oz Ag, net of by-products.
- Initial capital costs of $644.5 million and a post-tax payback of 2.4 years.
- LOM capex of $1.2 billion, including $422.7 million of growth capex and $166.5 million in sustaining capex; and
- Closure costs of $149.8 million.
|
__________________________ |
|
1 AgEq is calculated using: AgEq Oz = Ag Oz + Au Oz x (Au Price/Ag Price) + Zn lbs x (Zn Price/Ag Price) + Pb lbs x (Pb Price/Ag Price), metal prices shown in Table 1 |
The Project has robust economics, manageable upfront capex, annual silver production of approximately ten million ounces per year, and over one million ounces of gold produced over the life of mine. With the completion of the Updated Carangas PEA Technical Report, the Company will continue to advance technical work, including a 30,000 meters infill drilling program. Besides the technical works, the Company will also focus on advancing the Project’s permitting front aiming to complete the Exploration Licenses (“ELs”) to Administrative Mining Contracts (“AMCs”) conversion and to start the Environmental Impact Assessment Study (“EEIA”) process over the remaining periods of the year.
Economic Results and Sensitivities
Table 1 shows key assumptions and summarizes the projected production and economic results of the Updated Carangas PEA Technical Report. Tables 2 and 3 show sensitivities to silver and gold prices and Table 4 shows sensitivities to operating and capital costs.
|
Table 1: Carangas Open Pit Mining – Key Economic Assumptions and Results |
||
|
Item |
Unit |
Value |
|
Silver Price |
$/oz |
45.00 |
|
Gold Price |
$/oz |
3,400 |
|
Zinc Price |
$/lb |
1.20 |
|
Lead Price |
$/lb |
0.90 |
|
Total Mill Feed |
Mt |
251.5 |
|
Open Pit Strip Ratio1 |
t:t |
1.4 |
|
Annual Processing Rate |
Mtpa |
8.0 – 16.0 |
|
Average Silver Grade2 |
g/t |
36.2 |
|
Average Silver Head Grade in “pre-gold production period” |
g/t |
54.7 |
|
Average Gold Grade in “gold production period” |
g/t |
0.74 |
|
Silver Recovery to Silver/Lead Concentrate |
% |
79.4 |
|
Lead Recovery to Silver/Lead Concentrate |
% |
71.5 |
|
Silver Recovery to Zinc Concentrate |
% |
4.5 |
|
Zinc Recovery to Zinc Concentrate |
% |
62.1 |
|
Gold Recovery to Gold/Silver Dore |
% |
93.0 |
|
Silver Recovery to Gold/Silver Dore |
% |
60.0 |
|
Total Payable Silver |
Moz |
195.1 |
|
Total Payable Gold |
Moz |
1.1 |
|
Total Payable Zinc |
Mlbs |
1,453 |
|
Total Payable Lead |
Mlbs |
941 |
|
Mine Life3 |
Yrs |
19 |
|
Average Annual Payable Silver Metal over LOM |
Moz |
10.6 |
|
Annual Payable Silver Metal in “pre-gold production period” |
Moz |
15.5 |
|
Annual Payable Gold Metal in “gold production period” |
koz |
142.7 |
|
Total Revenue |
$M |
15,254 |
|
Total Cash Costs of Silver (net of by-products)4 |
$/oz |
(1.51) |
|
Government Royalties |
$/oz |
4.06 |
|
AISC (net of by-products)5 |
$/oz |
0.11 |
|
AISC (silver equivalent) |
$/oz |
19.16 |
|
AISC (gold equivalent) |
$/oz |
1,448 |
|
Initial Capital Costs |
$M |
644.5 |
|
Sustaining Capital Costs6 |
$M |
166.5 |
|
Payback Period (post-tax)7 |
Yrs |
2.4 |
|
Cumulative Net Cash Flow (pre-tax) |
$M |
7,691 |
|
Cumulative Net Cash Flow (post-tax) |
$M |
4,813 |
|
Post-tax NPV (5%) |
$M |
2,653 |
|
Post-tax IRR |
% |
35.9 |
|
Post-tax NPV (5%) to Initial Capex Ratio |
$:$ |
4.1 |
|
Notes |
|
|
1. |
LOM average strip ratio. |
|
2. |
LOM average Silver zone. |
|
3. |
Excludes 2 years pre-production period. |
|
4. |
Includes mining costs, processing costs, tailing costs, general and administrative (“G&A”) costs, royalties and selling costs. |
|
5. |
Includes total operating costs, royalties, sustaining capital costs, and closure costs. |
|
6. |
Excludes mine closure costs of $149.8 M. |
|
7. |
The payback period is measured from the beginning of production after construction is completed. |
|
Table 2: Economic Sensitivity Analysis for Silver Prices – Post-Tax |
|||||
|
Silver Price Sensitivity |
|||||
|
Silver Price (US$/oz) |
$22.50 (-50%) |
$33.75 (-25%) |
$45.00 (Base Case) |
$56.25 (+25%) |
$67.50 (+50%) |
|
Results (post-tax NPV $M / IRR) |
973/16.3% |
1,814/26.3% |
2,653/35.9% |
3,461/44.4% |
4,163/51.5% |
|
Note: Inputs for the base case (100%) are listed in Table 1. Table 2 presents how the Project’s post-tax NPV and IRR are affected by varying the selling price of silver. For example, if the silver price increases by $11.25/oz (from $45.00 to $56.25/oz) while other Inputs remain as the “Base Case”, then the NPV becomes $3,461 M and the IRR is 44.4%. NPV values are discounted at a rate of 5%. Gold, zinc and lead prices are kept constant at $3,400/oz, $1.20/lb and $0.90/lb respectively. |
|
Table 3: Economic Sensitivity Analysis for Gold Prices – Post-Tax |
|||||
|
Gold Price Sensitivity |
|||||
|
Gold Price (US$/oz) |
$1,700 (-50%) |
$2,550 (-25%) |
$3,400 (Base Case) |
$4,250 (+25%) |
$5,100 (+50%) |
|
Results (post-tax NPV $M / IRR) |
2,042/34.7% |
2,347/35.3% |
2,653/35.9% |
2,959/36.5% |
3,230/37.0% |
|
Note: Inputs for the base case (100%) are listed in Table 1. Table 3 presents how the Project’s post-tax NPV and IRR are affected by varying the selling price of gold. For example, if the gold price increases by $850/oz (from $3,400 to $4,250/oz) while other Inputs remain as the “Base Case”, then the NPV becomes $2,959 M and the IRR is 36.4%. NPV values are discounted at a rate of 5%. Silver, zinc and lead prices are kept constant at $45,00/oz, $1.20/lb and $0.90/lb respectively. |
|
Table 4: Economic Sensitivity Analysis for Costs – Post-Tax |
|||||
|
Cost Sensitivity |
|||||
|
Sensitivity Items |
-20 % |
-10 % |
100% |
+10 % |
+20 % |
|
Recovery (post-tax NPV $M / IRR) |
1,632/26% |
2,143/31% |
2,653/36% |
3,133/40% |
3,497/44% |
|
Operating Cost (post-tax NPV $M / IRR) |
2,957/38% |
2,815/37% |
2,653/36% |
2,491/35% |
2,328/33% |
|
Initial Capex (post-tax NPV $M / IRR) |
2,775/43% |
2,714/39% |
2,653/36% |
2,592/33% |
2,531/31% |
|
Note: Inputs for the base case (100%) are listed in Table 1. Table 4 lists sensitivity analysis for three “Input” variables. For example, if Initial Capex increases by 20% (+20%), while silver price, operating cost, and recovery remain the same as the “Base Case” input, the NPV becomes $2,531 M and IRR is 31%. NPV values are discounted at a rate of 5%. |
Capital and Operating Costs
The Project, as outlined in the Updated Carangas PEA Technical Report, is anticipated to include contract mining open-pit operation, supplying mill feed to a conventional crushing, grinding and flotation circuit, which is expected to produce silver-lead and zinc concentrates. The operation is expected to be expanded from 8.0 million tonnes per year (“Mtpa”) to 16.0 Mtpa in year 6 by the addition of a twinned crushing, grinding and flotation circuit. In year 9, it is expected that an 8.0 Mtpa gold circuit (including cyanide leaching, counter-current decantation, Merril-Crowe, and smelting) will be put into operation. This circuit will make use of the crushing, grinding and rougher flotation units from the second concentrator plant. It is expected that the initial concentrator plant will continue to operate at 8.0 Mtpa producing silver-lead and zinc concentrates. The Updated Carangas PEA Technical Report anticipates the Project will have several capital and operating cost advantages:
- Mineralized material is flat-lying, which is anticipated to result in a pit with a final depth of approximately 520 meters below surface and a low LOM average strip ratio of 1.4:1;
- It is proposed that the mine will be operated by a contractor with current operations in Bolivia, eliminating the need for the Company to procure a mining fleet and sustain capital for fleet replacement;
- Bond ball mill work index (BBWi) averaging 12 kilowatt-hours per metric tonne (“kWh/t”) and a Bond abrasion index (Ai) averaging 0.06, therefore it is anticipated that processing mineralized material will require modest power consumption and low grinding media consumption;
- Test work shows that total silver recoveries to the silver/lead and zinc concentrates are favorable at 83.9% on average, with the silver/lead concentrate containing a high silver content expected to exceed 3,500 grams per tonne (“g/t”) for years 3 to 9, It is expected that the mine will be connected to the national electricity grid, providing low-cost power at $0.06/kWh to the processing plant and other on-site infrastructure; and
- The site can be accessed via national highways and all-season local roads.
|
Table 5: Total Operating Cost Estimate |
|
|
Item |
Cost ($/t milled) |
|
Mining1 |
8.43 |
|
Processing |
7.12 |
|
General and Administration |
1.38 |
|
Total operating cost |
16.93 |
|
Note |
|
|
1. |
Mining cost is $3.56/t mined. |
|
Table 6: Total Capital Cost Estimate |
|
|
Item |
Cost ($M) |
|
Mine development1 |
58.7 |
|
Processing plant |
202.1 |
|
On-Site infrastructure2 |
65.8 |
|
Off-Site Infrastructure3 |
114.5 |
|
Project Preliminaries (Indirect Costs) |
31.7 |
|
Project Delivery (EPCM) |
45.6 |
|
Owner’s cost |
15.7 |
|
Contingency |
110.3 |
|
Initial capital |
644.5 |
|
Life of mine growth capital4 |
422.7 |
|
Life of mine sustaining capital5 |
166.5 |
|
Closure Costs |
149.8 |
|
Note |
|
|
1. |
Includes pre-production capitalized operating costs of $55.3 M. |
|
2. |
Includes earthworks, power switchyard and distribution, fuel storage, sewage, potable water, water management, infrastructure buildings, tailings storage facility, tailings and reclaim pipelines, camp, and site services and mobile equipment. |
|
3. |
Includes access road, water supply, transmission line, and town relocation. |
|
4. |
Expansion capital costs include twinning of the concentrator plant in year 6 and addition of the gold plant in year 9. |
|
5. |
Sustaining capital costs include mining and tailings costs. |
Mining
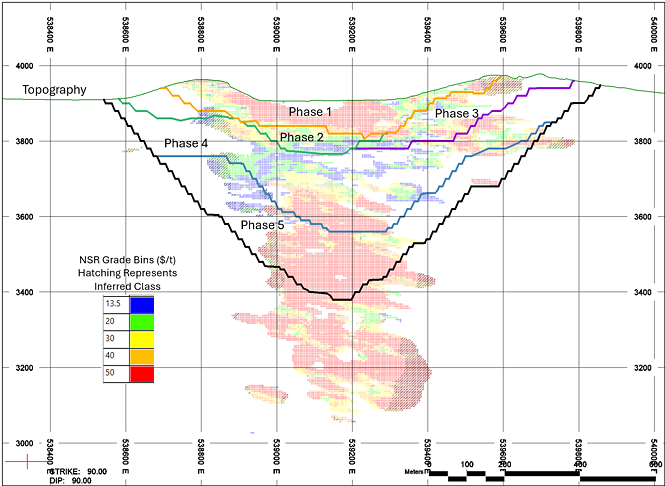
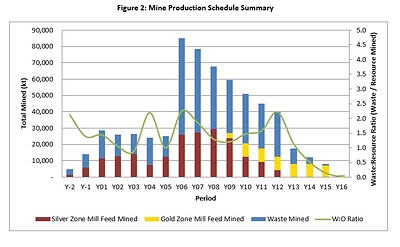
It is anticipated that the deposit will be mined using a conventional open pit approach. This entails drilling and blasting, with loading by hydraulic excavators and haulage by off-highway rear dump haul trucks. A SW-NE cross section showing the resource model grades and pit is illustrated in Figure 1. The mine production schedule is illustrated in Figure 2.
Mill feed tonnes and grade are a subset of the Mineral Resource Estimate (“MRE”), accounting for planned mining dilution and recovery. A mining net smelter return (“NSR”) cutoff grade of $13.50/t is applied and all mined material below this cutoff grade is treated as waste. The mining cutoff grade is chosen to cover process and G&A operating costs for the Project.
The Updated Carangas PEA Technical Report assumes that mill feed will be hauled to the primary crusher or a run-of-mine (“ROM”) stockpile near the crusher. A portion of the oxides and lower grade resources mined in the early years are planned to be stockpiled east of the open pit and processed over the life of mine. Waste rock will be hauled to waste storage facilities north of the open pit or to construct the tailings storage facility dam, further north of the open pit. It is anticipated that mine operations will be conducted by a contractor with current operations in Bolivia.
It is anticipated that open-pit mining will commence in the first year of construction. The mine plan anticipates that 19 Mt of waste and oxide material will be mined, over a two-year pre-production period. Peak open-pit production is expected to be 85 Mt per year. The planned open pit contains a total of 615 Mt of material (mineralized material and waste) which is scheduled to be mined out by Year 16 of milling operations. 105 Mt of oxide and lower grade material is planned to be stockpiled throughout the life of mine, with years 16-19 processing stockpiles exclusively. The stockpiled oxide is rehandled to the mill over the life of mine, targeting 13% of the overall silver zone mill feed.
|
Notes: Net Smelter Prices (“NSP”) and metallurgical recoveries are used to define the NSR cutoff grade. NSPs include market price assumptions of $40.0/oz Ag, $3,200/oz Au, $0.90/lb Pb, $1.20/lb Zn. Various smelter and refining terms, offsite costs, and a 5% royalty (6% for Ag) derive NSPs of $17.5/oz Ag in Zn concentrate, $34.4/oz Ag in Pb concentrate, $34.8/oz Ag in doré, $3,028/oz Au in doré, $1,070/t Pb, and $1,270/t Zn. Metallurgical recoveries of 6% Ag in Zn concentrate, 81.6% Ag in Pb concentrate, 60.4% Ag in doré, 93.4% Au in doré, 2.3% Pb in Zn concentrate, 73.4% Pb in Pb concentrate, 66.9% Zn in Zn concentrate, and 21.9% Zn in Pb concentrate are applied. The metal prices, smelter terms, and recoveries for the economic analysis are slightly different from the values described here. Checks have been made by the qualified person to ensure that the mine plan would not be materially altered by revising these inputs to the metal prices used to evaluate the project economics in the Updated Carangas PEA Technical Report. |
Mineral Processing
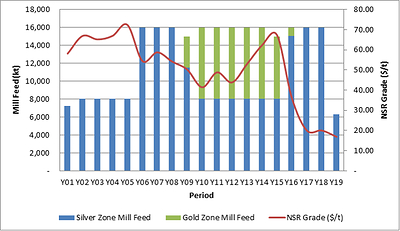
The Project is designed to process 8.0 Mtpa of mineralized material in the first 5 years, and 16.0 Mtpa in years 6 to 18. The overall mill production schedule is illustrated in Figure 3. The processing facility will use conventional comminution circuits followed by selective sequential flotation to produce a lead/silver concentrate and a zinc/silver concentrate. These circuits will include primary crushing, followed by a SAG-Ball milling circuit and sequential selective flotation to separate silver/lead and zinc while rejecting pyrite and non-sulfidic gangue minerals. During years 9 to 16, the gold plant will use convention cyanide leaching for the gold flotation concentrate along with CCD, Merrill Crowe, and smelting circuits to produce gold doré. Tailings would then be thickened and pumped to a conventional storage facility.
Mineral Resource Estimate
The MRE, constrained by a conceptual open–pit shell for reporting purposes, is reported using a cut–off grade of 30 g/t AgEq and is presented in Table 6 with an effective date of March 31, 2026.
|
Table 7: Mineral Resource as of March 31, 2026 |
||||||||||||
|
Domain |
Category |
Tonnage |
AgEq |
Ag |
Au |
Pb |
Zn |
|||||
|
Mt |
g/t |
Mozs |
g/t |
Mozs |
g/t |
Kozs |
% |
Mlbs |
% |
Mlbs |
||
|
Upper Silver Zone |
Indicated |
121.6 |
70 |
272.4 |
44 |
173.9 |
0.06 |
220.0 |
0.34 |
923.3 |
0.65 |
1,729.6 |
|
Inferred |
33.6 |
67 |
72.9 |
42 |
45.9 |
0.11 |
119.6 |
0.29 |
211.6 |
0.48 |
357.6 |
|
|
Middle Zinc Zone |
Indicated |
38.7 |
41 |
51.3 |
12 |
15.1 |
0.06 |
68.8 |
0.37 |
314.1 |
0.81 |
688.0 |
|
Inferred |
9.1 |
39 |
11.5 |
9 |
2.6 |
0.05 |
15.3 |
0.38 |
77.1 |
0.85 |
172.2 |
|
|
Lower Gold Zone |
Indicated |
78.4 |
82 |
205.9 |
10 |
24.4 |
0.76 |
1,911.7 |
0.12 |
215.0 |
0.23 |
403.8 |
|
Inferred |
11.0 |
80 |
28.3 |
10 |
3.6 |
0.70 |
248.5 |
0.15 |
36.2 |
0.34 |
82.4 |
|
|
Total |
Indicated |
238.8 |
69 |
529.6 |
28 |
213.4 |
0.29 |
2,200.5 |
0.28 |
1,452.4 |
0.54 |
2,821.3 |
|
Inferred |
53.8 |
65 |
112.7 |
30 |
52.1 |
0.22 |
383.4 |
0.27 |
324.9 |
0.52 |
612.3 |
|
|
Source: compiled by SLR, 2026 |
|
|
Notes: |
|
|
1. |
CIM Definition Standards (2014) were used for reporting the Mineral Resources. |
|
2. |
The qualified person (as defined in NI 43-101) for the purposes of the MRE is Anderson Candido, FAusIMM, Principal Geologist with SLR. |
|
3. |
Mineral Resources are constrained by an optimized pit shell at a metal price of $41.00/oz Ag, $3,300.00/oz Au, $1.00/lb Pb, $1.30/lb Zn, $4.00/lb Cu, recovery of 81.6% Ag, 93.4% Au, 73.4% Pb, 66.9% Zn, 38.7% Cu and Cut-off grade of 30 g/t AgEq. |
|
4. |
AgEq formula is: AgEq g/t = Ag g/t + Au g/t * 80.49 + (Pb %*2204.6 /100 + Zn %*2866 /100 + Cu %* 8818.5 /100) / 1.318 |
|
5. |
Drilling results up to June 1, 2023. |
|
6. |
The numbers may not compute exactly due to rounding. |
|
7. |
Mineral Resources are reported on a dry in-situ basis. |
|
8. |
Mineral resources are not Mineral Reserves and have not demonstrated economic viability. |
|
9. |
There are certain legal, political, environmental or other risks related to development of the Project. See “Cautionary Note Regarding Results of Preliminary Economic Assessment” and “Cautionary Note Regarding Forward-Looking Information” |
Next Steps
The strong economics shown in the Updated Carangas PEA Technical Report warrant New Pacific continuing to advance both the technical and permitting aspects of the Project. Recent progress has been made with the local community including the signing of a framework community agreement earlier this year (see press release dated February 23, 2026), as well as successfully completing a prior consultation on July 6 to obtain community and other regional stakeholders’ consent as part of the requirements for the conversion of the Carangas ELs to AMCs. The application process for the ELs to AMCs conversion started in 2025 and all required documents have been submitted to the Bolivia’s Ministry of Mining and Metallurgy since then. With the recently completed prior consultation, the Company expects that the remaining administrative work and legislative approval of the conversion of the ELs to AMCs could take up to six months.
With the progress made on obtaining the AMCs, the Company plans to begin a 30,000 metre drilling campaign at Carangas in September 2026. Approximately 25,000 metres of drilling will be focused on converting inferred resources to indicated resources, with the balance of the drilling testing the Carangas gold zone for possible extensions and new step out targets. As part of this work, the Company will also gather samples for feasibility level metallurgical test work and conduct geotechnical and hydrological drilling.
Once the AMCs are obtained, the Company will start the application to obtain its environmental categorization as a proposed open pit operation from Bolivia’s Ministry of Environment and Water, formally commencing the EEIA process. Work will also commence on gathering baseline environmental and social data as well as other associated technical work to fulfill the requirements of the EEIA. It is expected that this work will be completed by the end of 2027.
Qualified Persons
The qualified persons for the Updated Carangas PEA Technical Report are Mr. Anderson Candido, FAusIMM, Principal Geologist with SLR Mr. Jinxing Ji, P.Eng., Metallurgist with JJ Metallurgical Services, Mr. Kevin Murray, P.Eng., Principle Process Engineer with Ausenco Engineering Canada ULC (“Ausenco”), Mr. Scott Elfen, PE, SME, and Global Technical Lead (Geotechnical) with Ausenco, Mr. James Millard, P.Geo., Director Strategic Projects with Ausenco, and Mr. Marc Schulte, P.Eng., Mining Engineer with Moose Mountain Technical Services. The specific sections for which each qualified person is responsible will be outlined in the Updated Carangas PEA Technical Report. All such qualified persons have reviewed and verified the technical content in this news release relevant to the sections of the Updated Carangas PEA Technical Report for which they are responsible. The qualified persons have verified the information disclosed relative to the sections they have responsibility for in the report.
Further details, including risks and uncertainties will be included in the Updated Carangas PEA Technical Report which will be posted under the Company’s profile at sedarplus.com within 45 days of this news release.
This news release has been reviewed and approved by Alex Zhang, P.Geo., Vice President of Exploration of New Pacific Metals Corp. who is the designated qualified person for the Company.
About New Pacific Metals
New Pacific is a Canadian exploration and development company advancing two permitting stage precious metals projects in Bolivia. Its Silver Sand project in Potosí has the potential to become one of the world’s largest silver mines. The Carangas Silver–Gold project in Oruro strengthens the Company’s portfolio through scale, robust economics, and regional exploration potential. With near a decade of operating experience in Bolivia, New Pacific has earned the confidence of its stakeholders and shareholders.
For Further Information
Peter Lekich, Director Investor Relations and Corporate Development
Phone: (604) 633–1368 Ext. 223,
U.S. & Canada toll-free: 1-877-631-0593
E-mail: [email protected]
For additional information and to receive company news by e-mail, please register using New Pacific’s website at www.newpacificmetals.com.
CAUTIONARY NOTE REGARDING RESULTS OF PRELIMINARY ECONOMIC ASSESSMENT
The results of the Preliminary Economic Assessment prepared in accordance with NI 43-101 titled “Carangas Project NI 43-101 Technical Report and Preliminary Economic Assessment” with an anticipated effective date of July 16, 2026 and prepared by certain qualified persons are preliminary in nature and are intended to provide an initial assessment of the Project’s economic potential and development options. The Updated Carangas PEA Technical Report mine schedule and economic assessment includes numerous assumptions and is based on both indicated and Inferred Mineral Resources. Inferred resources are considered too speculative geologically to have the economic considerations applied to them that would enable them to be categorized as Mineral Reserves, and there is no certainty that the preliminary economic assessments described herein will be achieved or that the Updated Carangas PEA Technical Report results will be realized. The estimate of Mineral Resources may be materially affected by geology, environmental, permitting, legal, title, socio-political, marketing or other relevant issues. Bolivia has recently experienced significant social unrest, including protests and blockades that led to a government-declared state of emergency. The Company’s projects have also previously been affected by illegal artisanal and small-scale mining activity, which resulted in disruption to operations. Such political and social instability could adversely affect the assumptions underlying the Updated Carangas PEA Technical Report, including anticipated permitting timelines, construction schedules, and operating costs. Mineral resources are not Mineral Reserves and do not have demonstrated economic viability. Additional exploration will be required to potentially upgrade the classification of the Inferred Mineral Resources to be considered in future advanced studies. The pit design for the deeper gold zone requires mining of waste (waste stripping) on Mining Concessions in the southern portion of the planned open pit that do not belong to the Company. These concessions include approximately 1.85% of the mineral resources that have been included in the economic analysis for this PEA. These Concessions are held by the state of Bolivia and are not currently available for tenure. Although the Company is actively working with the Bolivian government to obtain them, failure to do so, or to enter into a mining agreement on them could cause the Company to reevaluate the pit design and the outcome of this PEA. Ausenco Engineering Canada ULC (“Ausenco”) (Processing Plant, Infrastructure, Tailings, Water Management, Environment, Cost Estimate) was contracted to lead the PEA in cooperation with SLR Canada (minerals resources), Moose Mountain Technical Services (mining), and JJ Metallurgical Services (Metallurgy). The qualified persons for the Updated Carangas PEA Technical Report are Mr. Anderson Candido, FAusIMM, Principal Geologist with SLR Mr. Jinxing Ji, P.Eng., Metallurgist with JJ Metallurgical Services, Mr. Kevin Murray, P.Eng., Principle Process Engineer with Ausenco, Mr. Scott Elfen, PE, SME, and Global Technical Lead (Geotechnical) with Ausenco, Mr. James Millard, P. Geo., Director, Strategic Projects with Ausenco, and Mr. Marc Schulte, P.Eng., Mining Engineer with Moose Mountain Technical Services. All qualified persons for the Updated Carangas PEA Technical Report have reviewed and verified the disclosure of the Updated Carangas PEA Technical Report herein. The mineral resource estimate contained in the Updated Carangas PEA Technical Report is based on the MRE with an effective date of August 25, 2023, with a re-statement on March 31, 2026. Mineral Resources are constrained by an optimized pit shell at a metal price of $41.00/oz Ag, $3,300.00/oz Au, $1.00/lb Pb, $1.30/lb Zn, $4.00/lb Cu, recovery of 81.6% Ag, 93.4% Au, 73.4% Pb, 66.9% Zn, 38.7% Cu and Cut-off grade of 30 g/t AgEq. Assumptions made to derive a cut-off grade included mining costs, processing costs, and recoveries were obtained from comparable industry situations.
CAUTIONARY NOTE REGARDING FORWARD–LOOKING INFORMATION
Certain of the statements and information in this news release constitute “forward-looking statements” within the meaning of the United States Private Securities Litigation Reform Act of 1995 and “forward-looking information” within the meaning of applicable Canadian provincial securities laws. Any statements or information that express or involve discussions with respect to predictions, expectations, beliefs, plans, projections, objectives, assumptions, or future events or performance (often, but not always, using words or phrases such as “expects”, “is expected”, “anticipates”, “believes”, “plans”, “projects”, “estimates”, “assumes”, “intends”, “strategies”, “targets”, “goals”, “forecasts”, “objectives”, “budgets”, “schedules”, “potential” or variations thereof or stating that certain actions, events or results “may”, “could”, “would”, “might” or “will” be taken, occur or be achieved, or the negative of any of these terms and similar expressions) are not statements of historical fact and may be forward-looking statements or information. Such statements include, but are not limited to statements regarding: the results of the Updated Carangas PEA Technical Report and the timing of the filing of the Updated Carangas PEA Technical Report; expectations regarding the Project; estimates regarding net present value, Mineral Reserves and Mineral Resources; anticipated exploration, drilling, development, construction, and other activities or achievements of the Company; timing of receipt of permits and regulatory approvals; timing and receipt of conversion of ELs to AMCs; and estimates of the Company’s revenues and capital expenditures; anticipated cost advantages and operational framework; and other future plans, objectives or expectations of the Company.
Forward-looking statements or information are subject to a variety of known and unknown risks, uncertainties and other factors that could cause actual events or results to differ from those reflected in the forward-looking statements or information, including, without limitation, risks relating to: global economic and social impact of public health crisis; fluctuating equity prices, bond prices, commodity prices; calculation of resources, reserves and mineralization, general economic conditions, foreign exchange risks, interest rate risk, foreign investment risk; loss of key personnel; conflicts of interest; dependence on management, uncertainties relating to the availability and costs of financing needed in the future, environmental risks, operations and political conditions, the regulatory environment in Bolivia and Canada, risks associated with community relations and corporate social responsibility, and other factors described under the heading “Risk Factors” in the Company’s annual information form for the year ended June 30, 2025 and its other public filings. This list is not exhaustive of the factors that may affect any of the Company’s forward-looking statements or information.
The forward-looking statements are necessarily based on a number of estimates, assumptions, beliefs, expectations, and opinions of management as of the date of this news release that, while considered reasonable by management, are inherently subject to significant business, economic and competitive uncertainties and contingencies. These estimates, assumptions, beliefs, expectations and options include, but are not limited to, those related to the Company’s ability to carry on current and future operations, including: public health crisis on our operations and workforce; development and exploration activities; the timing, extent, duration and economic viability of such operations; the accuracy and reliability of estimates, projections, forecasts, studies and assessments; the Company’s ability to meet or achieve estimates, projections and forecasts; the stabilization of the political climate in Bolivia; the Company’s ability to obtain and maintain social license at its mineral properties; the availability and cost of inputs; the price and market for outputs; foreign exchange rates; taxation levels; the timely receipt of necessary approvals or permits, including the ratification and approval of the Mining Production Contract with Corporación Minera de Bolivia, the Bolivian state mining corporation, by the Plurinational Legislative Assembly of Bolivia; the ability of the Company’s Bolivian partner to convert the Els at the Company’s Carangas project to AMCs; the ability to meet current and future obligations; the ability to obtain timely financing on reasonable terms when required; the current and future social, economic and political conditions; and other assumptions and factors generally associated with the mining industry.
Although the forward-looking statements contained in this news release are based upon what management believes are reasonable assumptions, there can be no assurance that actual results will be consistent with these forward-looking statements. All forward-looking statements in this news release are qualified by these cautionary statements. Accordingly, readers should not place undue reliance on such statements. Other than specifically required by applicable laws, the Company is under no obligation and expressly disclaims any such obligation to update or alter the forward-looking statements whether as a result of new information, future events or otherwise except as may be required by law. These forward-looking statements are made as of the date of this news release.
CAUTIONARY NOTE TO US INVESTORS
This news release has been prepared in accordance with the requirements of the securities laws in effect in Canada which differ from the requirements of United States securities laws. The technical and scientific information contained herein has been prepared in accordance with NI 43-101, which differs from the standards adopted by the U.S. Securities and Exchange Commission (the “SEC”). Accordingly, the technical and scientific information contained herein, including any estimates of Mineral Reserves and Mineral Resources, may not be comparable to similar information disclosed by United States companies subject to the disclosure requirements of the SEC.
Additional information relating to the Company, including the AIF, can be obtained under the Company’s profile on SEDAR+ at www.sedarplus.ca, on EDGAR at www.sec.gov, and on the Company’s website at www.newpacificmetals.com.

 View original content to download multimedia:https://www.prnewswire.com/news-releases/new-pacific-metals-reports-results-of-updated-carangas-preliminary-economic-assessment-post-tax-2-65-billion-npv-5-and-35-9-irr-339-0-million-oz-of-silver-equivalent-produced-302827198.html
SOURCE New Pacific Metals Corp.
