
Housing starts and construction data for October 2026
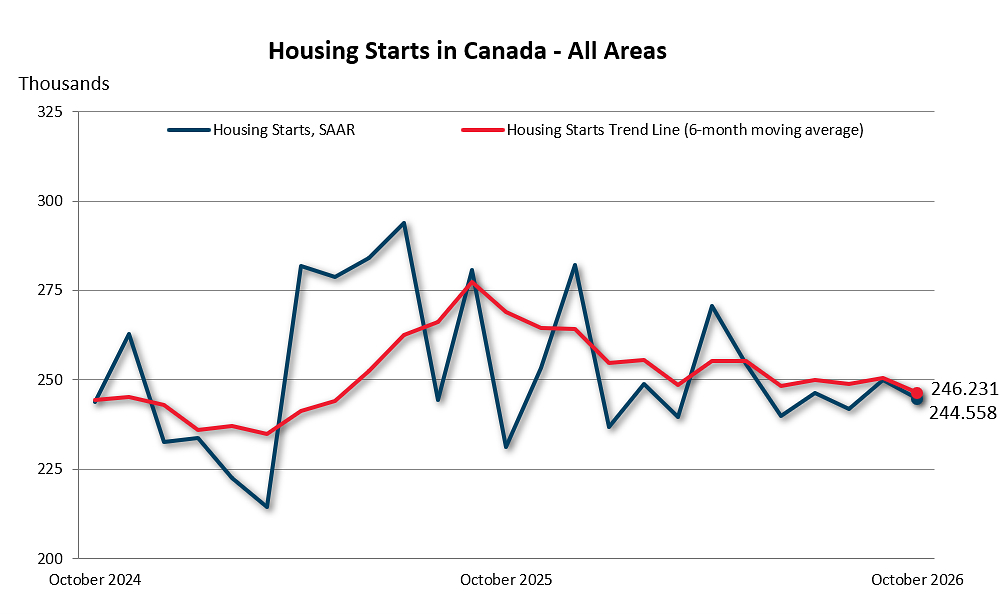
OTTAWA, ON, Nov. 17, 2026 /CNW/ — The six-month trend in housing starts declined 1.7% in October to 246,231 units, according to Canada Mortgage and Housing Corporation (CMHC). The trend measure is a six-month moving average of the seasonally adjusted annual rate (SAAR) of total housing starts for all areas in Canada.
Actual monthly housing starts were up 6% year-over-year in centres with a population of 10,000 or more, with 21,059 units recorded in October 2026, compared to 19,806 units in October 2025. The year-to-date total of actual housing starts in centres with a population of 10,000 or more was 192,023 units from January to October 2026, down 3% from the same period in 2025.
The total monthly SAAR of housing starts for all areas in Canada was down 2% in October (244,558 units) compared to September (250,072 units).
The number of units under construction in centres with a population of 50,000 or more in October was flat month-over-month at 369,569 units compared to September. Completions increased with construction finishing on 21,621 units, up 24% compared to September. The number of units with approved building permits but not yet started (pending starts) decreased 3% month-to-month to 139,592 units in October.
Quote:
“October’s results signal reduced momentum for housing construction, with the national trend decreasing, driven by declines in Ontario, British Columbia, and the Atlantic provinces. The decline in pending starts suggests some softness in the near-term construction pipeline and should be monitored carefully. As noted in our latest Housing Supply Report, under-building during the current market downturn presents a risk for future affordability and could intensify supply pressures as demand recovers.”
– Kevin Hughes, Deputy Chief Economist at CMHC
Key Facts:
- The rural starts monthly SAAR estimate was 13,675 units.
- Among Canada’s three largest CMAs, Montreal posted a 6% month-to-month increase in the six-month trend, driven by higher multi-unit starts. Vancouver recorded a 2% increase due to higher multi-unit starts while the trend measure in Toronto fell 10%, as the trends for both single-detached and multi-unit starts decreased.
- Read more about what housing starts measure and why they matter on CMHC’s Housing Observer.
- Monthly Housing Starts and Other Construction Data are accessible in English and French on our website and the CMHC Housing Market Information Portal.
- Housing starts data is available on the eleventh business day each month. We will release the November housing starts data on December 15 at 8:15 AM ET.
- CMHC uses the trend measure as a complement to the monthly SAAR of housing starts to account for considerable swings in monthly estimates and to obtain a clearer picture of upcoming new housing supply. In some situations, analyzing only SAAR data can be misleading, as the multi-unit segment largely drives the market and can vary significantly from one month to the next.
- Read about CMHC’s definitions and methodology to better understand the foundations of the Starts and Completions and Market Absorption surveys.
Housing starts data facilitates the analysis of monthly, quarterly, and year-over-year construction activity in the new home market. The data CMHC collects as part of the Starts and Completions and Market Absorption surveys helps us obtain a clearer picture of upcoming new housing supply and is used as part of our various housing reports.
Canada Mortgage and Housing Corporation (CMHC) is a federal Crown corporation and the foundation of Canada’s housing system. For over 80 years, CMHC has supported the functioning of housing markets across the country through housing finance solutions — including mortgage loan insurance and securitization — while providing trusted, unbiased data, research and market intelligence to inform policy and decision making. Through its national presence, deep expertise in housing economics and finance, and a system-wide perspective, CMHC helps foster a more stable, well-functioning housing market that supports households, communities and the broader economy.
Follow us on X, YouTube, LinkedIn, Facebook and Instagram.
Related Links:
- Housing starts for September 2026
- Slowing home construction threatens recent affordability gains: CMHC | CMHC
- Canada Housing Market Outlook: Summer 2026 | CMHC
- 2026 Mid-Year Rental Market Update | CMHC
- Supplying smarter: Learning to make housing supply more responsive | CMHC
|
Housing Construction Indicators, by Province for Centres 50,000 Population and Over |
|||||||||
|
September 2026-October 2026 |
|||||||||
|
Province/Centre |
Approved Units* Awaiting |
Under Construction |
Completions |
||||||
|
September 2026 |
October 2026 |
% |
September 2026 |
October 2026 |
% |
September 2026 |
October 2026 |
% |
|
|
Provinces |
|||||||||
|
N.L. |
383 |
258 |
-32,6 |
998 |
1 174 |
17,6 |
70 |
72 |
2,9 |
|
P.E.I. |
290 |
306 |
5,5 |
1 249 |
1 189 |
-4,8 |
42 |
147 |
## |
|
N.S. |
2 666 |
3 418 |
28,2 |
14 819 |
14 819 |
0 |
224 |
122 |
-45,5 |
|
N.B. |
1 279 |
1 085 |
-15,2 |
6 116 |
6 217 |
1,7 |
690 |
215 |
-68,8 |
|
Atlantic |
4 618 |
5 067 |
9,7 |
23 182 |
23 399 |
0,9 |
1 026 |
556 |
-45,8 |
|
Que. |
36 156 |
33 053 |
-8,6 |
57 573 |
59 057 |
2,6 |
2 429 |
4 651 |
91,5 |
|
Ont. |
34 448 |
34 138 |
-0,9 |
145 608 |
142 629 |
-2 |
6 871 |
7 331 |
6,7 |
|
Man. |
4 392 |
4 364 |
-0,6 |
9 938 |
9 373 |
-5,7 |
266 |
1 266 |
## |
|
Sask. |
1 809 |
1 739 |
-3,9 |
6 460 |
6 538 |
1,2 |
658 |
382 |
-41,9 |
|
Alta. |
23 875 |
24 771 |
3,8 |
46 345 |
46 487 |
0,3 |
3 135 |
3 616 |
15,3 |
|
Prairies |
30 076 |
30 874 |
2,7 |
62 743 |
62 398 |
-0,5 |
4 059 |
5 264 |
29,7 |
|
B.C. |
38 631 |
36 460 |
-5,6 |
82 511 |
82 086 |
-0,5 |
3 013 |
3 819 |
26,8 |
|
Canada 50,000+ |
143 929 |
139 592 |
-3 |
371 617 |
369 569 |
-0,6 |
17 398 |
21 621 |
24,3 |
|
Metropolitan Areas |
|||||||||
|
Abbotsford-Mission |
1 970 |
1 479 |
-24,9 |
2 900 |
3 256 |
12,3 |
67 |
123 |
83,6 |
|
Barrie |
842 |
918 |
9 |
2 140 |
2 340 |
9,3 |
229 |
75 |
-67,2 |
|
Belleville – Quinte West |
124 |
111 |
-10,5 |
777 |
804 |
3,5 |
88 |
24 |
-72,7 |
|
Brantford |
429 |
421 |
-1,9 |
1 357 |
1 351 |
-0,4 |
26 |
66 |
153,8 |
|
Calgary |
16 832 |
16 998 |
1 |
26 252 |
26 149 |
-0,4 |
1 329 |
1 954 |
47 |
|
Chilliwack |
86 |
94 |
9,3 |
1 125 |
1 123 |
-0,2 |
239 |
21 |
-91,2 |
|
Drummondville |
256 |
300 |
17,2 |
853 |
727 |
-14,8 |
107 |
177 |
65,4 |
|
Edmonton |
6 465 |
7 274 |
12,5 |
18 494 |
18 758 |
1,4 |
1 588 |
1 569 |
-1,2 |
|
Fredericton |
242 |
270 |
11,6 |
2 005 |
2 064 |
2,9 |
178 |
22 |
-87,6 |
|
Greater/Grand Sudbury |
32 |
32 |
0 |
647 |
562 |
-13,1 |
3 |
101 |
## |
|
Guelph |
108 |
111 |
2,8 |
325 |
296 |
-8,9 |
27 |
36 |
33,3 |
|
Halifax |
2 495 |
3 234 |
29,6 |
14 573 |
14 593 |
0,1 |
205 |
88 |
-57,1 |
|
Hamilton |
882 |
877 |
-0,6 |
6 733 |
6 445 |
-4,3 |
54 |
324 |
## |
|
Kamloops |
347 |
511 |
47,3 |
993 |
1 082 |
9 |
57 |
11 |
-80,7 |
|
Kelowna |
1 134 |
919 |
-19 |
3 862 |
3 204 |
-17 |
312 |
839 |
168,9 |
|
Kingston |
725 |
729 |
0,6 |
1 954 |
1 960 |
0,3 |
36 |
16 |
-55,6 |
|
Kitchener-Cambridge- |
1 250 |
1 205 |
-3,6 |
6 820 |
6 552 |
-3,9 |
176 |
461 |
161,9 |
|
Lethbridge |
387 |
301 |
-22,2 |
527 |
517 |
-1,9 |
52 |
43 |
-17,3 |
|
London |
2 644 |
2 546 |
-3,7 |
5 857 |
5 903 |
0,8 |
550 |
113 |
-79,5 |
|
Moncton |
509 |
294 |
-42,2 |
3 318 |
3 392 |
2,2 |
443 |
149 |
-66,4 |
|
Montréal |
21 712 |
19 704 |
-9,2 |
34 558 |
34 728 |
0,5 |
1 421 |
3 000 |
111,1 |
|
Nanaimo |
242 |
146 |
-39,7 |
1 226 |
1 316 |
7,3 |
15 |
15 |
0 |
|
Oshawa |
1 127 |
1 261 |
11,9 |
2 895 |
2 855 |
-1,4 |
49 |
56 |
14,3 |
|
Ottawa-Gatineau |
6 522 |
5 547 |
-14,9 |
21 758 |
22 218 |
2,1 |
447 |
1 240 |
177,4 |
|
Gatineau |
2 193 |
2 040 |
-7 |
3 376 |
3 797 |
12,5 |
28 |
318 |
## |
|
Ottawa |
4 329 |
3 507 |
-19 |
18 382 |
18 421 |
0,2 |
419 |
922 |
120 |
|
Peterborough |
82 |
62 |
-24,4 |
220 |
233 |
5,9 |
5 |
9 |
80 |
|
Québec |
6 974 |
6 858 |
-1,7 |
11 516 |
12 064 |
4,8 |
143 |
600 |
## |
|
Red Deer |
62 |
53 |
-14,5 |
203 |
212 |
4,4 |
128 |
12 |
-90,6 |
|
Regina |
299 |
275 |
-8 |
2 087 |
2 133 |
2,2 |
233 |
130 |
-44,2 |
|
Saguenay |
916 |
802 |
-12,4 |
947 |
1 016 |
7,3 |
56 |
49 |
-12,5 |
|
St. Catharines- |
1 202 |
1 361 |
13,2 |
4 659 |
4 752 |
2 |
89 |
87 |
-2,2 |
|
Saint John |
528 |
521 |
-1,3 |
793 |
761 |
-4 |
69 |
44 |
-36,2 |
|
St. John’s |
383 |
258 |
-32,6 |
998 |
1 174 |
17,6 |
70 |
72 |
2,9 |
|
Saskatoon |
1 510 |
1 464 |
-3 |
4 373 |
4 405 |
0,7 |
425 |
252 |
-40,7 |
|
Sherbrooke |
839 |
608 |
-27,5 |
1 554 |
1 763 |
13,4 |
349 |
40 |
-88,5 |
|
Thunder Bay |
119 |
131 |
10,1 |
569 |
469 |
-17,6 |
7 |
108 |
## |
|
Toronto |
19 526 |
20 086 |
2,9 |
88 108 |
85 216 |
-3,3 |
4 766 |
4 791 |
0,5 |
|
Trois-Rivières |
993 |
1 003 |
1 |
740 |
720 |
-2,7 |
62 |
65 |
4,8 |
|
Vancouver |
32 288 |
30 639 |
-5,1 |
61 680 |
62 335 |
1,1 |
2 142 |
1 818 |
-15,1 |
|
Victoria |
2 344 |
2 464 |
5,1 |
9 353 |
8 417 |
-10 |
89 |
936 |
## |
|
Windsor |
417 |
308 |
-26,1 |
1 303 |
1 484 |
13,9 |
148 |
66 |
-55,4 |
|
Winnipeg |
4 233 |
4 196 |
-0,9 |
9 615 |
9 037 |
-6 |
220 |
1 252 |
## |
|
CMA Total |
140 077 |
136 371 |
-2,6 |
360 667 |
358 386 |
-0,6 |
16 699 |
20 854 |
24,9 |
|
*Units with approved building permits (excluding conversions) that have not yet begun construction and are not yet counted as housing starts. These units, where no construction activity has yet been observed through CMHC’s Starts and Completions Survey (SCS), may be indicative of future housing starts. |
|||||||||
|
## not calculable / extreme value |
|||||||||
|
Source: CMHC Starts and Completions Survey (SCS) |
|||||||||
|
© 2026 Canada Mortgage and Housing Corporation |
|
Housing Start – Seasonally Adjusted at Annual Rates – 6 Month Moving Average (Trend) |
||||||||||
|
Mises en chantier – Nombres désaisonnalisés annualisés – Moyenne mobile sur six mois (tendance) |
||||||||||
|
October / octobre 2026 |
||||||||||
|
Single-Detached |
All Others |
|||||||||
|
Maisons individuelles |
Autres |
Total |
||||||||
|
September / |
October / |
% |
September / |
October / |
% |
September / |
October / |
% |
||
|
Provinces (10,000+) |
||||||||||
|
Nfld.Lab. |
656 |
681 |
4 |
823 |
889 |
8 |
1 479 |
1 570 |
6 |
|
|
P.E.I. |
267 |
258 |
-3 |
1 266 |
1 160 |
-8 |
1 533 |
1 418 |
-8 |
|
|
N.S. |
1 255 |
1 210 |
-4 |
5 061 |
4 877 |
-4 |
6 316 |
6 088 |
-4 |
|
|
N.B. |
881 |
882 |
0 |
5 255 |
5 179 |
-1 |
6 136 |
6 061 |
-1 |
|
|
Que. |
4 999 |
5 030 |
1 |
49 375 |
49 884 |
1 |
54 374 |
54 915 |
1 |
|
|
Ont. |
10 165 |
10 259 |
1 |
47 875 |
43 171 |
-10 |
58 040 |
53 429 |
-8 |
|
|
Man. |
2 197 |
2 097 |
-5 |
6 380 |
6 326 |
-1 |
8 577 |
8 423 |
-2 |
|
|
Sask. |
1 859 |
1 795 |
-3 |
5 188 |
4 944 |
-5 |
7 047 |
6 739 |
-4 |
|
|
Alta. |
13 884 |
13 855 |
0 |
36 125 |
37 727 |
4 |
50 009 |
51 582 |
3 |
|
|
B.C. |
3 448 |
3 541 |
3 |
38 507 |
36 963 |
-4 |
41 954 |
40 504 |
-3 |
|
|
Canada (10,000+) |
39 611 |
39 607 |
0 |
195 853 |
191 120 |
-2 |
235 464 |
230 728 |
-2 |
|
|
Canada (All Areas / |
46 574 |
46 782 |
0 |
204 014 |
199 450 |
-2 |
250 587 |
246 231 |
-2 |
|
|
Metropolitan Areas / |
||||||||||
|
Abbotsford-Mission |
85 |
102 |
20 |
1 564 |
2 130 |
36 |
1 649 |
2 232 |
35 |
|
|
Barrie |
265 |
257 |
-3 |
932 |
1 442 |
55 |
1 197 |
1 699 |
42 |
|
|
Belleville – Quinte West |
171 |
189 |
11 |
172 |
230 |
34 |
343 |
419 |
22 |
|
|
Brantford |
182 |
187 |
3 |
620 |
584 |
-6 |
802 |
771 |
-4 |
|
|
Calgary |
5 926 |
6 026 |
2 |
18 970 |
20 010 |
5 |
24 896 |
26 036 |
5 |
|
|
Chilliwack |
91 |
96 |
5 |
1 046 |
438 |
-58 |
1 138 |
534 |
-53 |
|
|
Drummondville |
228 |
203 |
-11 |
998 |
656 |
-34 |
1 226 |
859 |
-30 |
|
|
Edmonton |
6 189 |
6 009 |
-3 |
14 566 |
15 016 |
3 |
20 755 |
21 025 |
1 |
|
|
Fredericton |
312 |
327 |
5 |
1 678 |
1 780 |
6 |
1 990 |
2 107 |
6 |
|
|
Greater/Grand Sudbury |
95 |
100 |
5 |
230 |
230 |
– |
325 |
330 |
2 |
|
|
Guelph |
21 |
19 |
-10 |
254 |
240 |
-6 |
275 |
259 |
-6 |
|
|
Halifax |
570 |
556 |
-2 |
4 444 |
4 274 |
-4 |
5 014 |
4 830 |
-4 |
|
|
Hamilton |
209 |
181 |
-13 |
894 |
914 |
2 |
1 103 |
1 095 |
-1 |
|
|
Kamloops |
69 |
65 |
-6 |
1 282 |
754 |
-41 |
1 351 |
819 |
-39 |
|
|
Kelowna |
205 |
245 |
20 |
1 522 |
1 470 |
-3 |
1 727 |
1 715 |
-1 |
|
|
Kingston |
135 |
131 |
-3 |
630 |
650 |
3 |
765 |
781 |
2 |
|
|
Kitchener-Cambridge- |
576 |
638 |
11 |
2 730 |
1 320 |
-52 |
3 306 |
1 958 |
-41 |
|
|
Lethbridge |
258 |
266 |
3 |
468 |
472 |
1 |
726 |
737 |
2 |
|
|
London |
596 |
620 |
4 |
3 490 |
1 842 |
-47 |
4 086 |
2 462 |
-40 |
|
|
Moncton |
234 |
232 |
-1 |
3 177 |
3 102 |
-2 |
3 411 |
3 334 |
-2 |
|
|
Montréal |
1 246 |
1 276 |
2 |
26 789 |
28 300 |
6 |
28 034 |
29 576 |
6 |
|
|
Nanaimo |
140 |
112 |
-20 |
878 |
650 |
-26 |
1 018 |
762 |
-25 |
|
|
Oshawa |
258 |
287 |
11 |
568 |
556 |
-2 |
826 |
843 |
2 |
|
|
Ottawa-Gatineau |
2 511 |
2 557 |
2 |
11 538 |
11 399 |
-1 |
14 048 |
13 954 |
-1 |
|
|
Gatineau |
324 |
306 |
-6 |
2 069 |
2 010 |
-3 |
2 393 |
2 315 |
-3 |
|
|
Ottawa |
2 187 |
2 251 |
3 |
9 469 |
9 389 |
-1 |
11 655 |
11 639 |
0 |
|
|
Peterborough |
98 |
124 |
27 |
260 |
272 |
5 |
358 |
396 |
11 |
|
|
Québec |
810 |
829 |
2 |
10 232 |
10 692 |
4 |
11 042 |
11 521 |
4 |
|
|
Red Deer |
126 |
128 |
2 |
158 |
174 |
10 |
284 |
302 |
6 |
|
|
Regina |
403 |
388 |
-4 |
1 988 |
1 516 |
-24 |
2 391 |
1 904 |
-20 |
|
|
Saguenay |
181 |
196 |
8 |
964 |
1 064 |
10 |
1 145 |
1 260 |
10 |
|
|
St. Catharines-Niagara |
419 |
391 |
-7 |
1 576 |
1 790 |
14 |
1 995 |
2 181 |
9 |
|
|
Saint John |
170 |
151 |
-11 |
474 |
486 |
3 |
644 |
637 |
-1 |
|
|
St. John’s |
571 |
587 |
3 |
768 |
852 |
11 |
1 339 |
1 439 |
7 |
|
|
Saskatoon |
1 360 |
1 322 |
-3 |
3 114 |
3 340 |
7 |
4 474 |
4 662 |
4 |
|
|
Sherbrooke |
307 |
313 |
2 |
1 284 |
1 516 |
18 |
1 591 |
1 829 |
15 |
|
|
Thunder Bay |
67 |
56 |
-16 |
438 |
432 |
-1 |
505 |
488 |
-3 |
|
|
Toronto |
2 645 |
2 555 |
-3 |
22 180 |
19 744 |
-11 |
24 825 |
22 299 |
-10 |
|
|
Trois-Rivières |
131 |
135 |
3 |
914 |
914 |
– |
1 045 |
1 049 |
0 |
|
|
Vancouver |
1 765 |
1 852 |
5 |
24 192 |
24 734 |
2 |
25 957 |
26 586 |
2 |
|
|
Victoria |
274 |
272 |
-1 |
4 266 |
3 098 |
-27 |
4 540 |
3 370 |
-26 |
|
|
Windsor |
375 |
367 |
-2 |
812 |
858 |
6 |
1 187 |
1 225 |
3 |
|
|
Winnipeg |
1 857 |
1 762 |
-5 |
5 914 |
5 850 |
-1 |
7 771 |
7 612 |
-2 |
|
|
Data based on 2021 Census Definitions. |
Données fondées sur les définitions du recensement de 2021 |
||||
|
Source: Market Analysis Centre, CMHC |
Source : Centre d’analyse de marché, SCHL |
||||
|
Housing Start Data in Centres 10,000 Population and Over |
||||||||||
|
January – October 2025 – 2026 |
||||||||||
|
Area |
Single-Detached |
All Others |
Total |
|||||||
|
Province |
||||||||||
|
2025 |
2026 |
% |
2025 |
2026 |
% |
2025 |
2026 |
% |
||
|
N.L. |
572 |
564 |
-1 |
317 |
720 |
127 |
889 |
1 284 |
44 |
|
|
P.E.I. |
290 |
228 |
-21 |
866 |
1 014 |
17 |
1 156 |
1 242 |
7 |
|
|
N.S. |
1 361 |
1 046 |
-23 |
5 888 |
3 745 |
-36 |
7 249 |
4 791 |
-34 |
|
|
N.B. |
790 |
735 |
-7 |
3 549 |
3 762 |
6 |
4 339 |
4 497 |
4 |
|
|
Atlantic |
3 013 |
2 573 |
-15 |
10 620 |
9 241 |
-13 |
13 633 |
11 814 |
-13 |
|
|
Que. |
3 978 |
4 282 |
8 |
39 730 |
41 300 |
4 |
43 708 |
45 582 |
4 |
|
|
Ont. |
8 240 |
8 153 |
-1 |
41 599 |
40 497 |
-3 |
49 839 |
48 650 |
-2 |
|
|
Man. |
1 937 |
1 809 |
-7 |
3 807 |
5 007 |
32 |
5 744 |
6 816 |
19 |
|
|
Sask. |
1 505 |
1 480 |
-2 |
3 492 |
3 366 |
-4 |
4 997 |
4 846 |
-3 |
|
|
Alta. |
13 142 |
11 462 |
-13 |
32 406 |
28 068 |
-13 |
45 548 |
39 530 |
-13 |
|
|
Prairies |
16 584 |
14 751 |
-11 |
39 705 |
36 441 |
-8 |
56 289 |
51 192 |
-9 |
|
|
B.C. |
3 420 |
3 053 |
-11 |
30 950 |
31 732 |
3 |
34 370 |
34 785 |
1 |
|
|
Canada |
35 235 |
32 812 |
-7 |
162 604 |
159 211 |
-2 |
197 839 |
192 023 |
-3 |
|
|
Metropolitan Areas |
||||||||||
|
Abbotsford-Mission |
142 |
104 |
-27 |
1 897 |
1 291 |
-32 |
2 039 |
1 395 |
-32 |
|
|
Barrie |
129 |
197 |
53 |
559 |
769 |
38 |
688 |
966 |
40 |
|
|
Belleville – Quinte West |
139 |
136 |
-2 |
380 |
119 |
-69 |
519 |
255 |
-51 |
|
|
Brantford |
240 |
179 |
-25 |
1 329 |
691 |
-48 |
1 569 |
870 |
-45 |
|
|
Calgary |
5 776 |
4 961 |
-14 |
18 175 |
14 509 |
-20 |
23 951 |
19 470 |
-19 |
|
|
Chilliwack |
112 |
91 |
-19 |
382 |
560 |
47 |
494 |
651 |
32 |
|
|
Drummondville |
182 |
170 |
-7 |
854 |
732 |
-14 |
1 036 |
902 |
-13 |
|
|
Edmonton |
5 805 |
4 986 |
-14 |
12 184 |
11 066 |
-9 |
17 989 |
16 052 |
-11 |
|
|
Fredericton |
223 |
257 |
15 |
879 |
984 |
12 |
1 102 |
1 241 |
13 |
|
|
Greater/Grand Sudbury |
82 |
89 |
9 |
133 |
157 |
18 |
215 |
246 |
14 |
|
|
Guelph |
27 |
19 |
-30 |
126 |
166 |
32 |
153 |
185 |
21 |
|
|
Halifax |
690 |
488 |
-29 |
5 203 |
3 070 |
-41 |
5 893 |
3 558 |
-40 |
|
|
Hamilton |
261 |
163 |
-38 |
1 891 |
1 127 |
-40 |
2 152 |
1 290 |
-40 |
|
|
Kamloops |
68 |
75 |
10 |
304 |
1 171 |
## |
372 |
1 246 |
## |
|
|
Kelowna |
218 |
185 |
-15 |
2 096 |
1 383 |
-34 |
2 314 |
1 568 |
-32 |
|
|
Kingston |
166 |
137 |
-17 |
793 |
337 |
-58 |
959 |
474 |
-51 |
|
|
Kitchener-Cambridge-Waterloo |
363 |
429 |
18 |
3 293 |
2 698 |
-18 |
3 656 |
3 127 |
-14 |
|
|
Lethbridge |
304 |
227 |
-25 |
201 |
433 |
115 |
505 |
660 |
31 |
|
|
London |
394 |
465 |
18 |
2 198 |
2 779 |
26 |
2 592 |
3 244 |
25 |
|
|
Moncton |
244 |
198 |
-19 |
1 968 |
2 241 |
14 |
2 212 |
2 439 |
10 |
|
|
Montréal |
1 113 |
1 070 |
-4 |
21 060 |
21 123 |
0 |
22 173 |
22 193 |
0 |
|
|
Nanaimo |
79 |
93 |
18 |
309 |
607 |
96 |
388 |
700 |
80 |
|
|
Oshawa |
329 |
258 |
-22 |
518 |
329 |
-36 |
847 |
587 |
-31 |
|
|
Ottawa-Gatineau |
1 440 |
1 942 |
35 |
8 422 |
9 563 |
14 |
9 862 |
11 505 |
17 |
|
|
Gatineau |
339 |
303 |
-11 |
1 578 |
2 070 |
31 |
1 917 |
2 373 |
24 |
|
|
Ottawa |
1 101 |
1 639 |
49 |
6 844 |
7 493 |
9 |
7 945 |
9 132 |
15 |
|
|
Peterborough |
65 |
84 |
29 |
17 |
147 |
## |
82 |
231 |
182 |
|
|
Québec |
591 |
685 |
16 |
7 075 |
7 795 |
10 |
7 666 |
8 480 |
11 |
|
|
Red Deer |
117 |
95 |
-19 |
242 |
233 |
-4 |
359 |
328 |
-9 |
|
|
Regina |
328 |
351 |
7 |
1 235 |
1 215 |
-2 |
1 563 |
1 566 |
0 |
|
|
Saguenay |
196 |
176 |
-10 |
370 |
907 |
145 |
566 |
1 083 |
91 |
|
|
St. Catharines-Niagara |
357 |
372 |
4 |
1 284 |
1 624 |
26 |
1 641 |
1 996 |
22 |
|
|
Saint John |
201 |
152 |
-24 |
260 |
271 |
4 |
461 |
423 |
-8 |
|
|
St. John’s |
530 |
477 |
-10 |
297 |
644 |
117 |
827 |
1 121 |
36 |
|
|
Saskatoon |
1 111 |
1 088 |
-2 |
2 164 |
2 104 |
-3 |
3 275 |
3 192 |
-3 |
|
|
Sherbrooke |
219 |
236 |
8 |
1 093 |
1 555 |
42 |
1 312 |
1 791 |
37 |
|
|
Thunder Bay |
81 |
62 |
-23 |
123 |
317 |
158 |
204 |
379 |
86 |
|
|
Toronto |
2 732 |
1 989 |
-27 |
18 842 |
17 308 |
-8 |
21 574 |
19 297 |
-11 |
|
|
Trois-Rivières |
143 |
120 |
-16 |
1 110 |
722 |
-35 |
1 253 |
842 |
-33 |
|
|
Vancouver |
1 806 |
1 600 |
-11 |
20 195 |
20 663 |
2 |
22 001 |
22 263 |
1 |
|
|
Victoria |
238 |
230 |
-3 |
3 891 |
3 027 |
-22 |
4 129 |
3 257 |
-21 |
|
|
Windsor |
274 |
291 |
6 |
653 |
646 |
-1 |
927 |
937 |
1 |
|
|
Winnipeg |
1 685 |
1 538 |
-9 |
3 229 |
4 518 |
40 |
4 914 |
6 056 |
23 |
|
|
Total |
29 200 |
26 465 |
-9 |
147 234 |
141 601 |
-4 |
176 434 |
168 066 |
-5 |
|
1 Data for 2024, 2025 and 2026 based on 2021 Census Definitions. |
|
Source: CMHC Starts and Completion Survey, Market Absorption Survey |
|
Housing Start Data in Centres 10,000 Population and Over |
||||||||||
|
October 2025 – 2026 |
||||||||||
|
Area |
Single-Detached |
All Others |
Total |
|||||||
|
Province |
||||||||||
|
2025 |
2026 |
% |
2025 |
2026 |
% |
2025 |
2026 |
% |
||
|
N.L. |
62 |
49 |
-21 |
37 |
212 |
## |
99 |
261 |
164 |
|
|
P.E.I. |
48 |
29 |
-40 |
26 |
58 |
123 |
74 |
87 |
18 |
|
|
N.S. |
141 |
107 |
-24 |
562 |
113 |
-80 |
703 |
220 |
-69 |
|
|
N.B. |
89 |
72 |
-19 |
353 |
270 |
-24 |
442 |
342 |
-23 |
|
|
Atlantic |
340 |
257 |
-24 |
978 |
653 |
-33 |
1 318 |
910 |
-31 |
|
|
Que. |
501 |
515 |
3 |
5 425 |
5 996 |
11 |
5 926 |
6 511 |
10 |
|
|
Ont. |
1 045 |
873 |
-16 |
2 683 |
3 783 |
41 |
3 728 |
4 656 |
25 |
|
|
Man. |
226 |
158 |
-30 |
301 |
587 |
95 |
527 |
745 |
41 |
|
|
Sask. |
239 |
154 |
-36 |
450 |
319 |
-29 |
689 |
473 |
-31 |
|
|
Alta. |
1 231 |
1 210 |
-2 |
3 603 |
2 760 |
-23 |
4 834 |
3 970 |
-18 |
|
|
Prairies |
1 696 |
1 522 |
-10 |
4 354 |
3 666 |
-16 |
6 050 |
5 188 |
-14 |
|
|
B.C. |
421 |
331 |
-21 |
2 363 |
3 463 |
47 |
2 784 |
3 794 |
36 |
|
|
Canada |
4 003 |
3 498 |
-13 |
15 803 |
17 561 |
11 |
19 806 |
21 059 |
6 |
|
|
Metropolitan Areas |
||||||||||
|
Abbotsford-Mission |
15 |
18 |
20 |
212 |
461 |
117 |
227 |
479 |
111 |
|
|
Barrie |
0 |
19 |
## |
60 |
256 |
## |
60 |
275 |
## |
|
|
Belleville – Quinte West |
21 |
22 |
5 |
30 |
29 |
-3 |
51 |
51 |
– |
|
|
Brantford |
18 |
13 |
-28 |
31 |
53 |
71 |
49 |
66 |
35 |
|
|
Calgary |
545 |
596 |
9 |
2 513 |
1 262 |
-50 |
3 058 |
1 858 |
-39 |
|
|
Chilliwack |
13 |
8 |
-38 |
20 |
11 |
-45 |
33 |
19 |
-42 |
|
|
Drummondville |
16 |
8 |
-50 |
79 |
43 |
-46 |
95 |
51 |
-46 |
|
|
Edmonton |
526 |
445 |
-15 |
979 |
1 405 |
44 |
1 505 |
1 850 |
23 |
|
|
Fredericton |
24 |
30 |
25 |
177 |
53 |
-70 |
201 |
83 |
-59 |
|
|
Greater/Grand Sudbury |
11 |
10 |
-9 |
6 |
6 |
– |
17 |
16 |
-6 |
|
|
Guelph |
4 |
2 |
-50 |
8 |
2 |
-75 |
12 |
4 |
-67 |
|
|
Halifax |
81 |
48 |
-41 |
471 |
62 |
-87 |
552 |
110 |
-80 |
|
|
Hamilton |
29 |
13 |
-55 |
58 |
24 |
-59 |
87 |
37 |
-57 |
|
|
Kamloops |
6 |
6 |
– |
2 |
94 |
## |
8 |
100 |
## |
|
|
Kelowna |
20 |
27 |
35 |
162 |
102 |
-37 |
182 |
129 |
-29 |
|
|
Kingston |
42 |
12 |
-71 |
56 |
10 |
-82 |
98 |
22 |
-78 |
|
|
Kitchener-Cambridge-Waterloo |
90 |
73 |
-19 |
41 |
120 |
193 |
131 |
193 |
47 |
|
|
Lethbridge |
30 |
29 |
-3 |
0 |
4 |
## |
30 |
33 |
10 |
|
|
London |
26 |
49 |
88 |
163 |
110 |
-33 |
189 |
159 |
-16 |
|
|
Moncton |
22 |
25 |
14 |
94 |
191 |
103 |
116 |
216 |
86 |
|
|
Montréal |
161 |
160 |
-1 |
2 681 |
3 005 |
12 |
2 842 |
3 165 |
11 |
|
|
Nanaimo |
14 |
5 |
-64 |
20 |
100 |
## |
34 |
105 |
## |
|
|
Oshawa |
26 |
16 |
-38 |
36 |
0 |
-100 |
62 |
16 |
-74 |
|
|
Ottawa-Gatineau |
201 |
248 |
23 |
709 |
1 061 |
50 |
910 |
1 309 |
44 |
|
|
Gatineau |
31 |
25 |
-19 |
102 |
320 |
## |
133 |
345 |
159 |
|
|
Ottawa |
170 |
223 |
31 |
607 |
741 |
22 |
777 |
964 |
24 |
|
|
Peterborough |
7 |
16 |
129 |
0 |
6 |
## |
7 |
22 |
## |
|
|
Québec |
62 |
74 |
19 |
984 |
1 076 |
9 |
1 046 |
1 150 |
10 |
|
|
Red Deer |
21 |
13 |
-38 |
1 |
8 |
## |
22 |
21 |
-5 |
|
|
Regina |
44 |
40 |
-9 |
114 |
133 |
17 |
158 |
173 |
9 |
|
|
Saguenay |
14 |
22 |
57 |
43 |
96 |
123 |
57 |
118 |
107 |
|
|
St. Catharines-Niagara |
41 |
34 |
-17 |
99 |
149 |
51 |
140 |
183 |
31 |
|
|
Saint John |
26 |
4 |
-85 |
16 |
8 |
-50 |
42 |
12 |
-71 |
|
|
St. John’s |
56 |
41 |
-27 |
25 |
211 |
## |
81 |
252 |
## |
|
|
Saskatoon |
183 |
107 |
-42 |
331 |
184 |
-44 |
514 |
291 |
-43 |
|
|
Sherbrooke |
22 |
13 |
-41 |
105 |
237 |
126 |
127 |
250 |
97 |
|
|
Thunder Bay |
3 |
6 |
100 |
12 |
2 |
-83 |
15 |
8 |
-47 |
|
|
Toronto |
327 |
178 |
-46 |
1 118 |
1 722 |
54 |
1 445 |
1 900 |
31 |
|
|
Trois-Rivières |
8 |
11 |
38 |
217 |
34 |
-84 |
225 |
45 |
-80 |
|
|
Vancouver |
244 |
170 |
-30 |
1 384 |
2 304 |
66 |
1 628 |
2 474 |
52 |
|
|
Victoria |
27 |
28 |
4 |
331 |
257 |
-22 |
358 |
285 |
-20 |
|
|
Windsor |
24 |
34 |
42 |
32 |
213 |
## |
56 |
247 |
## |
|
|
Winnipeg |
188 |
128 |
-32 |
203 |
546 |
169 |
391 |
674 |
72 |
|
|
Total |
3 238 |
2 801 |
-13 |
13 623 |
15 650 |
15 |
16 861 |
18 451 |
9 |
|
|
1 Data for 2024, 2025 and 2026 based on 2021 Census Definitions. |
|
Source: CMHC Starts and Completion Survey, Market Absorption Survey |

SOURCE Canada Mortgage and Housing Corporation (CMHC)
